$GYDQW
&RQWUROOHU8VHU¶V*XLGH
6HFWLRQ *HQHUDO6\VWHP8WL OLWLHV
3BSE 002 415R701 Rev A 3-53
3HUIRUPDQFH/RJJLQJ
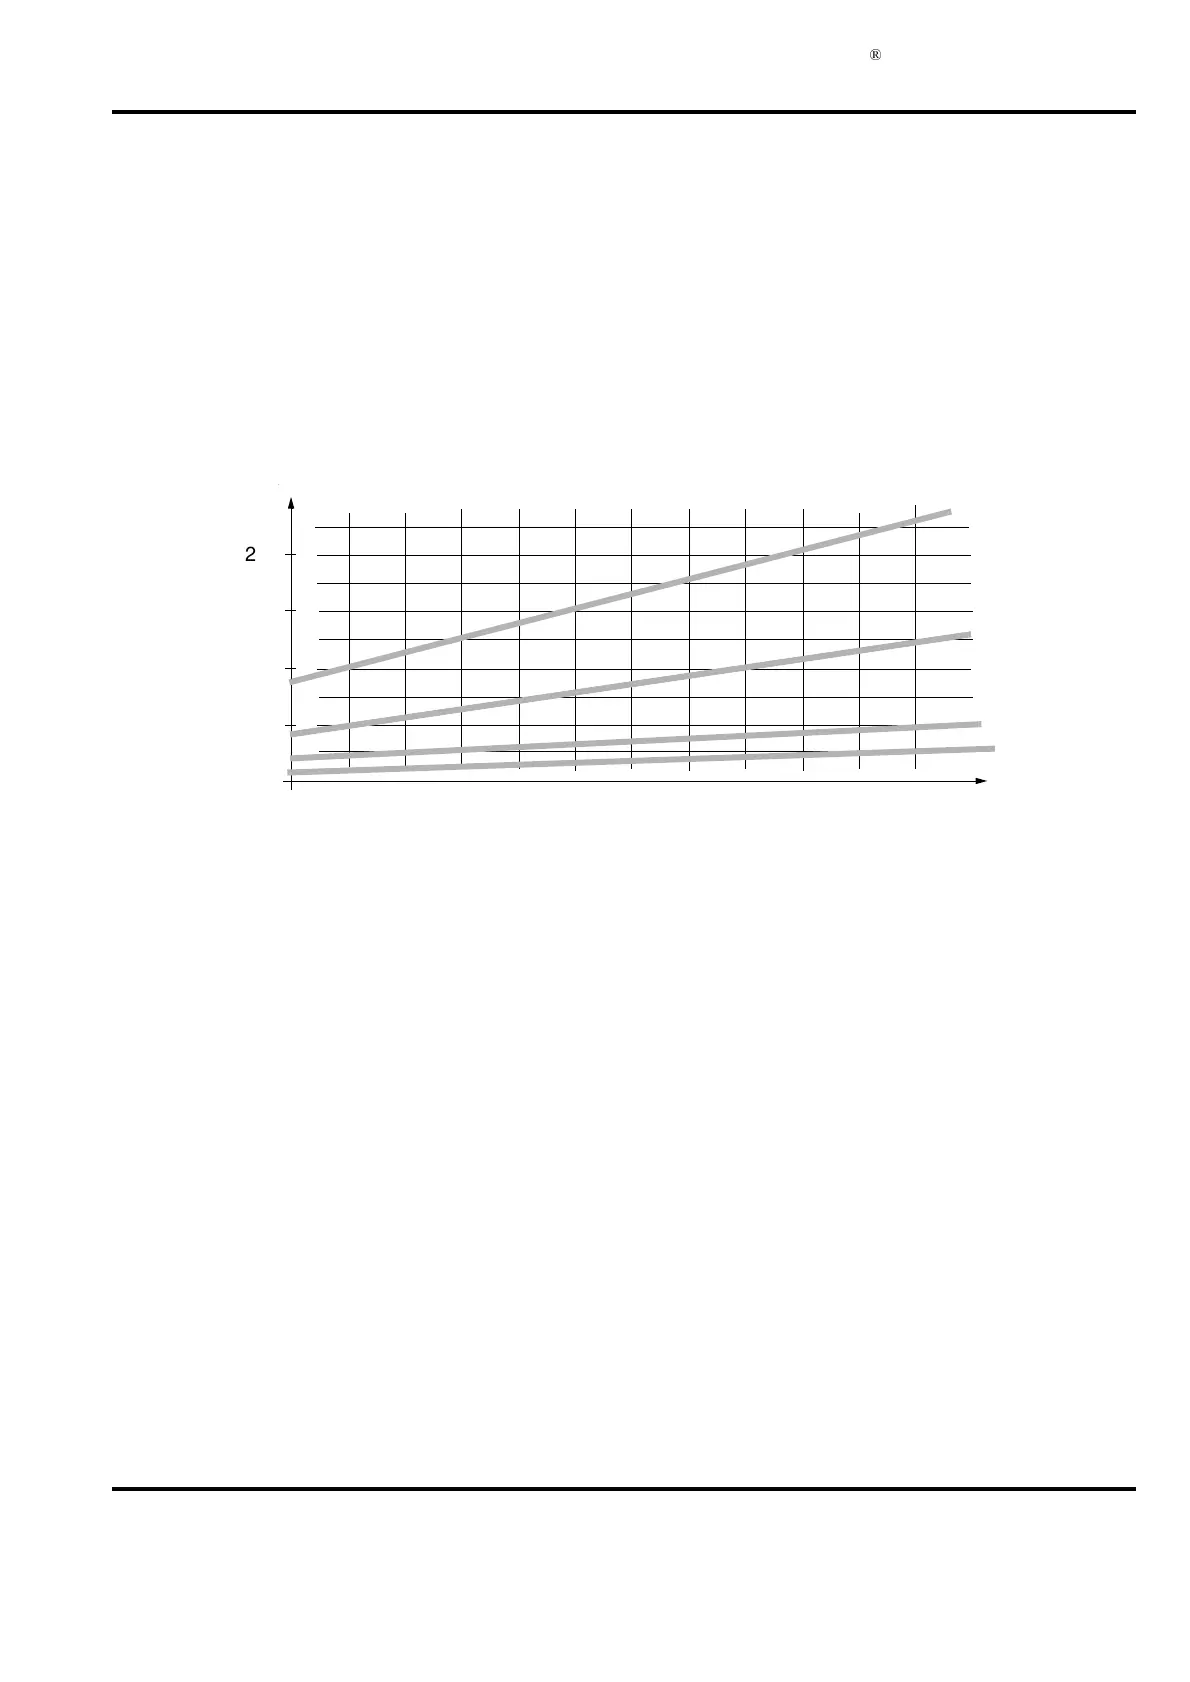
The load caused by each individual log can be estimated from the diagrams and models below.
Finally make an addition.
The lowest configured value of sampling interval or log interval for an actual log is used when
entering the diagrams. In that way the different load caused by a momentary log and a mean
value log is practically considered.
A primary and a secondary log is treated in the same way when analyzing the CPU load.
The secondary log normally gets its data from a primary log. This means that the load data from
the primary log and the secondary log must be added up.
6KRUW/RJ,QWHUYDOVVV
)LJXUH /RDG&DXVHGE\D/RJ6KRUW,QWHUYDOV
1.5
1.0
0.5
612182430
Number of
variables
2.0
1 s
2 s
5 s
10 s
log interval
(sampling interval
at mean value log)
in the log
 Loading...