MAN B&W 2.02
Page 2 of 2
MAN Diesel
198 38 782.5MAN B&W MC/MC-C, ME/ME-GI/ME -B engines
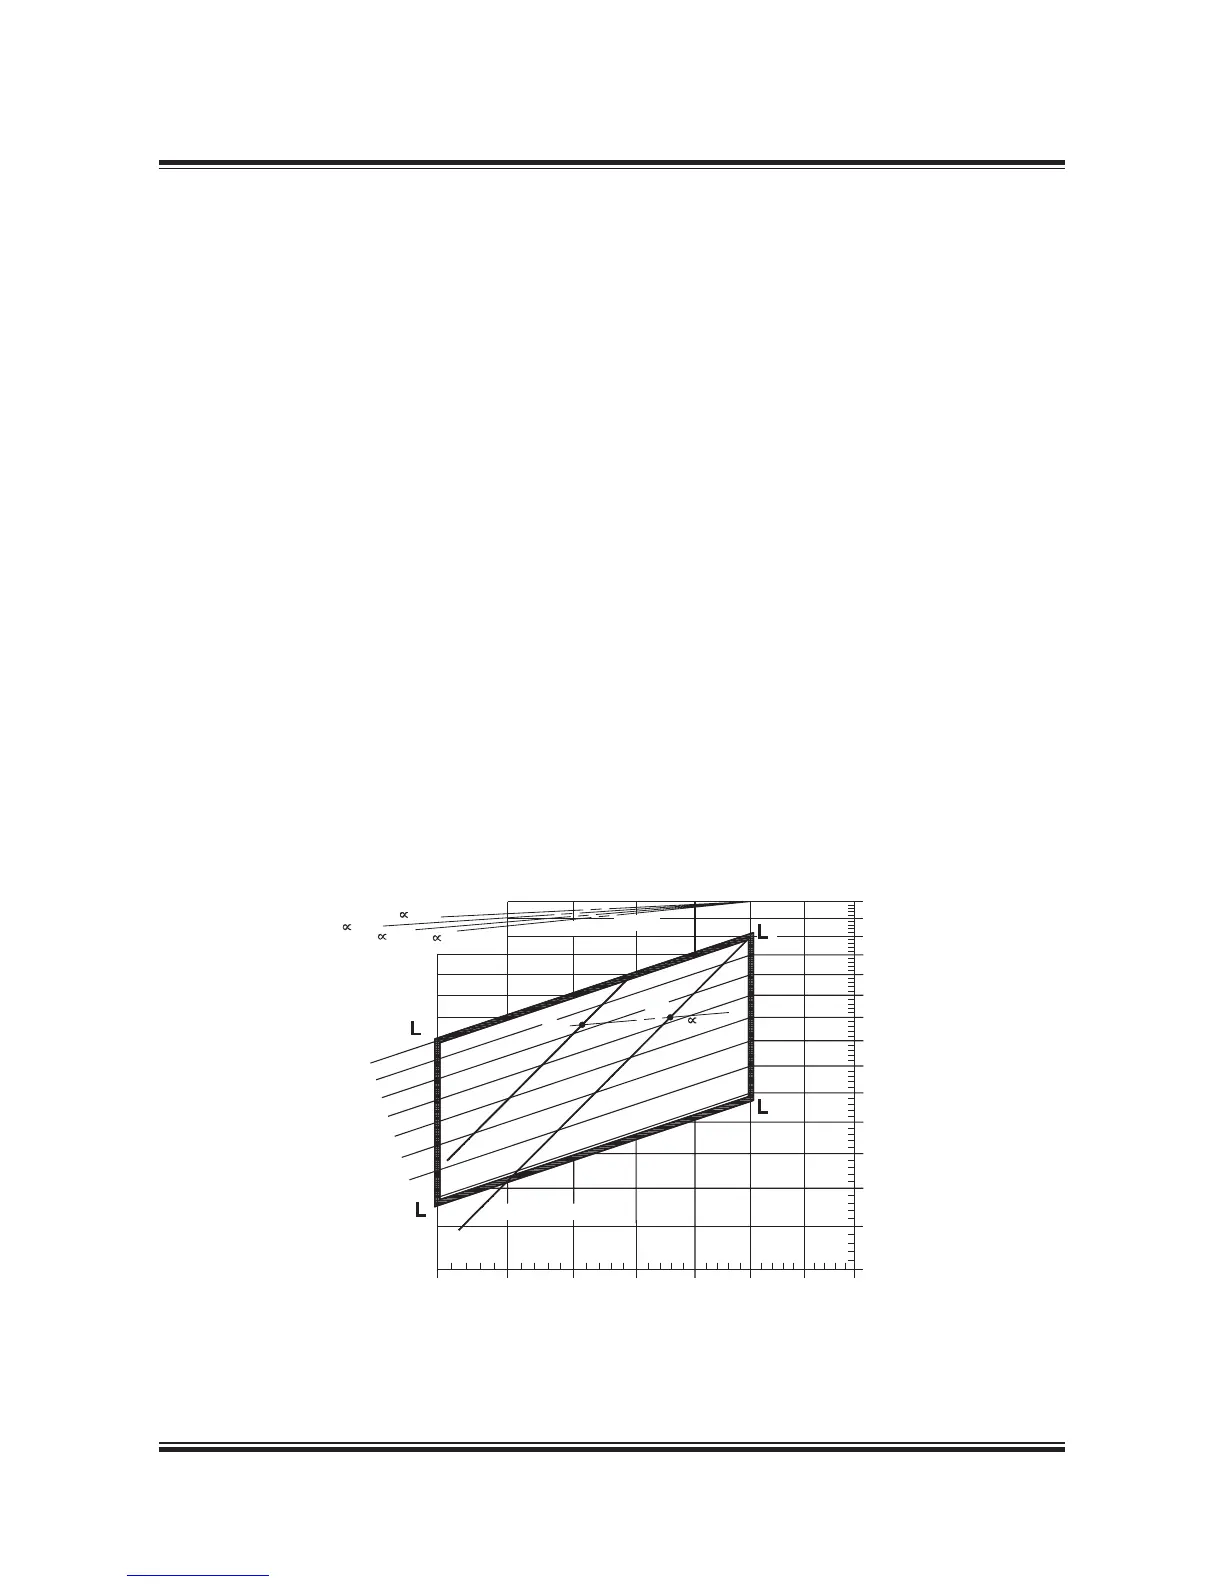
Constant ship speed lines
The constant ship speed lines ∝, are shown at
the very top of Fig. 2.02.02. These lines indicate
the power required at various propeller speeds to
keep the same ship speed provided that the op-
timum propeller diameter with an optimum pitch
diameter ratio is used at any given speed, taking
into consideration the total propulsion efficiency.
Normally, the following relation between neces-
sary power and propeller speed can be assumed:
P
2
= P
1
x (n
2
/n
1
)
∝
where:
P = Propulsion power
n = Propeller speed, and
∝= the constant ship speed coefficient.
For any combination of power and speed, each
point on lines parallel to the ship speed lines gives
the same ship speed.
When such a constant ship speed line is drawn
into the layout diagram through a specified pro-
pulsion MCR point ‘MP
1
’, selected in the layout
area and parallel to one of the ∝lines, another
specified propulsion MCR point ‘MP
2
’ upon this
line can be chosen to give the ship the same
speed for the new combination of engine power
and speed.
Fig. 2.02.02 shows an example of the required
power speed point MP
1
, through which a constant
ship speed curve ∝= 0.25 is drawn, obtaining
point MP
2
with a lower engine power and a lower
engine speed but achieving the same ship speed.
Provided the optimum pitch/diameter ratio is used
for a given propeller diameter the following data
applies when changing the propeller diameter:
for general cargo, bulk carriers and tankers
∝= 0.25 0.30
and for reefers and container vessels
∝= 0.15 0.25
When changing the propeller speed by changing
the pitch diameter ratio, the ∝ constant will be dif-
ferent, see above.
Fig. 2.02.02: Layout diagram and constant ship speed lines
178 05 667.0
 Loading...