QX50/QX200/QX2000; (SW Version 6.0.x) 163
QX50/QX200/QX2000 Manual II: Administrator’s Guide
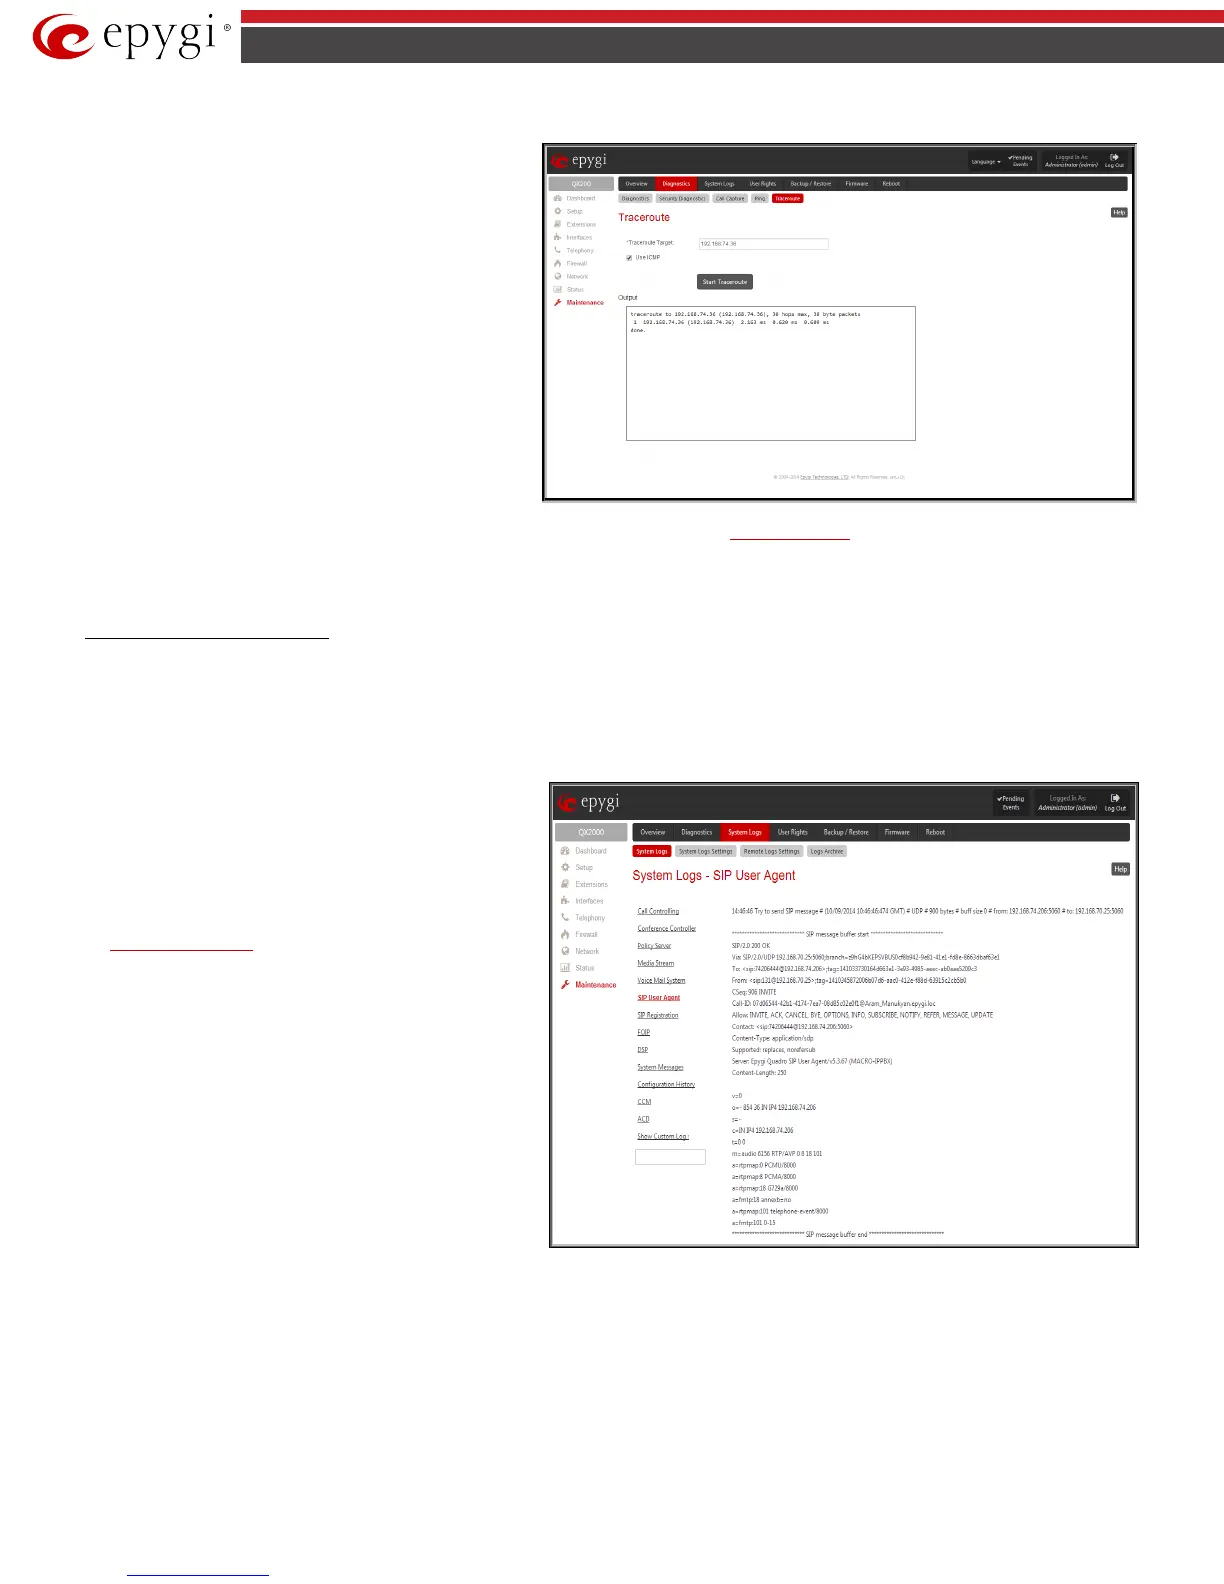
Traceroute
Traceroute
Target
is used to enter the IP address or host
name of the destination to be trace routed.
The Start Traceroute button is used to process the router
triggering to check the Internet connection.
In the field below these, the output of the Ping or Traceroute
procedure is shown.
Traceroute checks the Internet connection by triggering the
routers (hops) that are passed to reach the destination
specified in the Traceroute Target text field. Trace routing
gives feedback on the routers passed by packets on the way
toward the destination and the round trip delay of packets to
these routers.
Fig.II- 268: Diagnostics – Traceroute page
Attention: No Traceroute is possible if a high priority Firewall has been enabled (see chapter Firewall and NAT).
For the purpose of tracerouting, several IP packets are sent out. UDP (User Datagram Protocol) is used to send packets and ICMP (Internet Control
Message Protocol) is used to receive information about the routers. In their headers, the TTL (Time To Live) value increases from 1 to 30. When the first IP
frame is received by the first router, its IP address will be returned in its acknowledgement.
To Check the Internet connection
1. Specify the destination address for the ICMP request in the Ping Target text field.
2. Press the Start Ping button to process the ICMP request.
3. Specify the destination address to trace the route.
4. Press the Start Traceroute button to process the router triggering.
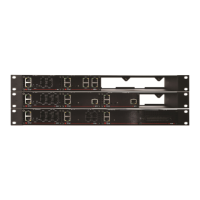
System Logs
System Logs
page you may view the generated logs on
the QX IP PBX. System logs are useful to determine any king of
problems on the QX IP PBX as well as to monitor the user’s
access and the usage of it.
On the left side of the page, a list of main logs is displayed.
Clicking on the needed link will display the most recent log
lines. The number of log lines displayed on this page is set on
the
System Logs Settings page.
The text field on the left side is dedicated for support personnel
only and is used to search a custom log not listed on this page.
To do so, insert a required log name to the text field and press
Show Custom Log functional button.
If the user has used Logs Collection (
) feature code
after or during (from another phone connected to the same QX
IP PBX) the call, a special log file will be generated containing
the details of that call and few last calls done in the system. This
log file will be internally kept in the system until the next time
someone used the Logs Collection feature code again. The
collected logs will be a part of the System Logs when user
downloads them next time, so it can be reviewed by appropriate
support staff. This could be used to collect the logs at the exact
moment when a problem has happened.
Fig.II- 269: System Logs page
System Logs Settings
This page is used to adjust system logging settings, view system logs directly in your browser or download them locally to your PC.
The System Logs Settings page is used to adjust the system logging settings and contains the following components.
The Enable User Logging checkbox is used to enable user level logging. This logging contains brief information about events on the QX IP PBX.
The Enable Developer Logging checkbox is used to enable developer high level logging. This logging contains detailed information about events on the
QX IP PBX.