56 Upgrade and Maintenance Manual TX140 S1
Basic hardware procedures
Ê For further diagnostics, proceed as follows:
– Hardware errors:
Check the System Event Log (SEL) as described in section "Viewing the
SEL" on page 113.
– Software / agent related errors:
Check the ServerView System Monitor, available on Windows or Linux
based servers with ServerView agents installed.
I For further information, please refer to the "ServerView System
Monitor" user guide, available from the ServerView Suite DVD 2
supplied with your PRIMERGY server or online at
http://manuals.ts.fujitsu.com (EMEA market) or
http://jp.fujitsu.com/platform/server/primergy/manual/ (Japanese
market).
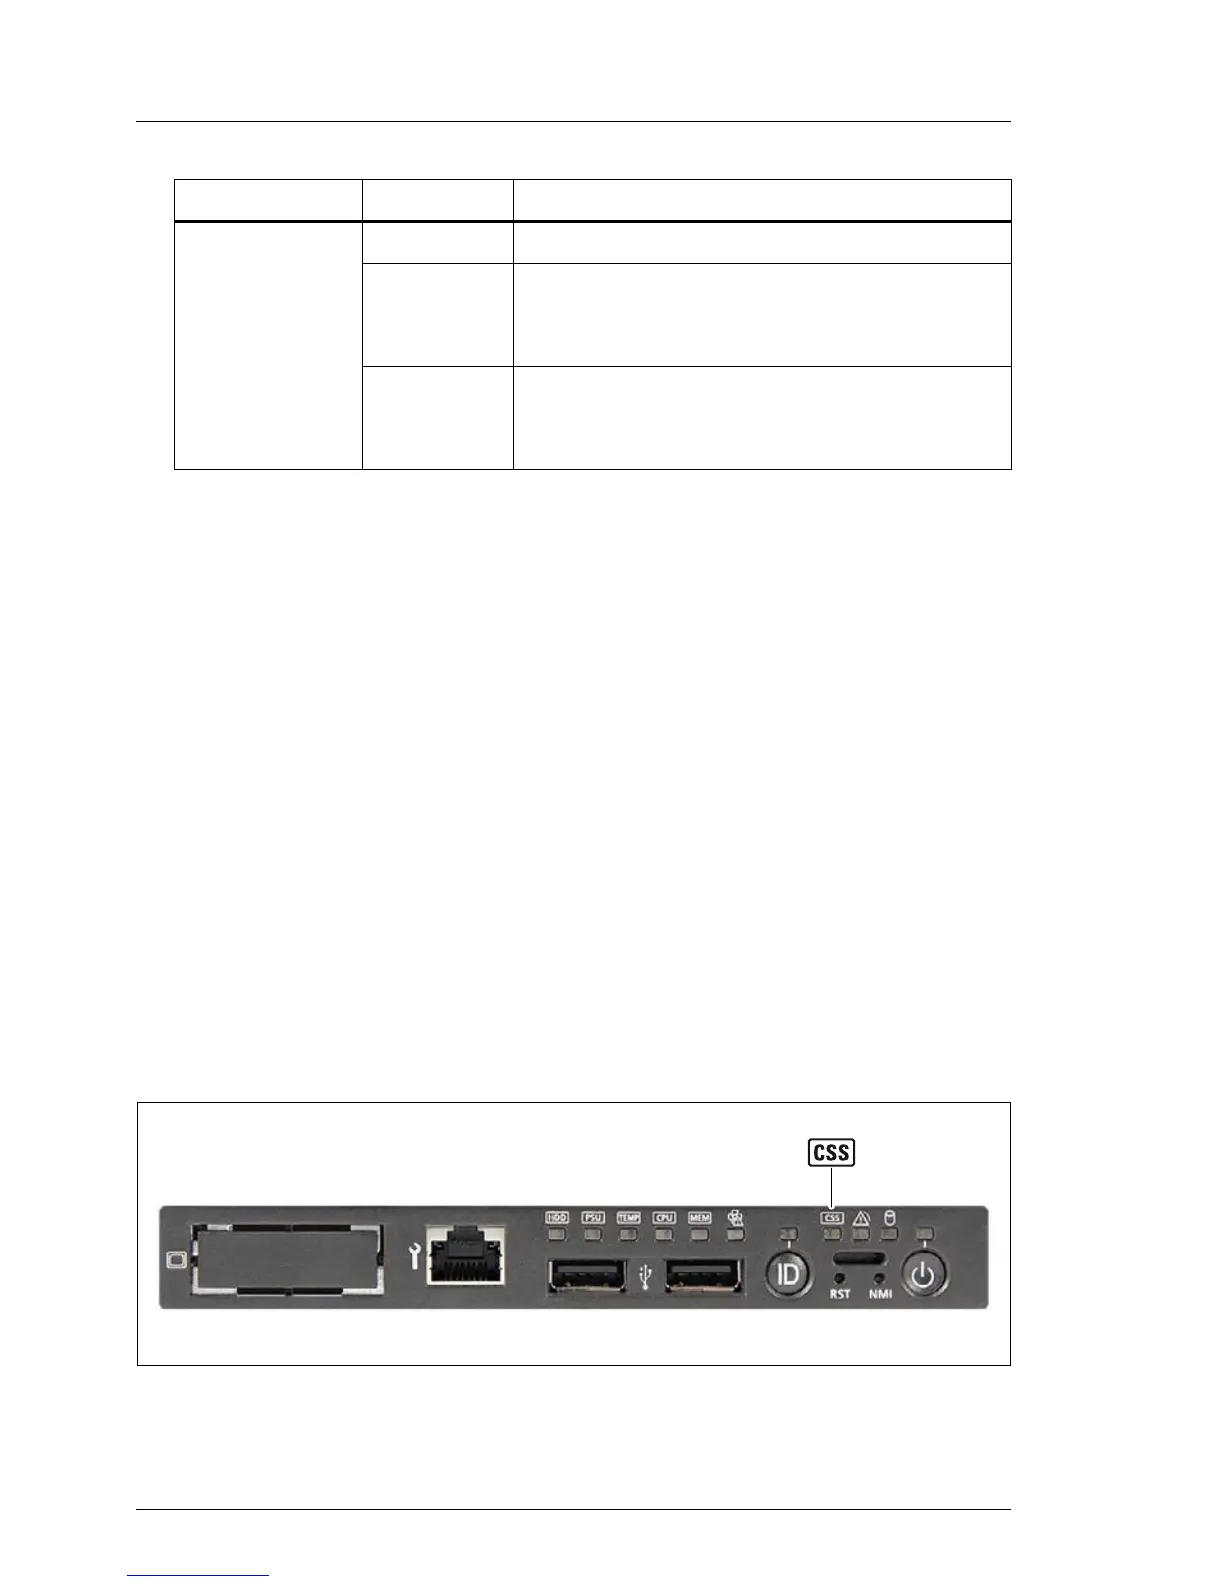
4.1.2.2 Customer Self Service (CSS) indicator
Figure 5: CSS error indicator in front panel
Ê Check the CSS indicator on the front panel or connector panel of the server:
Indicator Status Description
Global error
indicator
off no critical event (non CSS component)
orange on
prefailure detected (non CSS component),
requires (precautionary) service
intervention
orange
flashing
non CSS component failure or software /
agent related error, requires service
intervention
 Loading...