5-78 Image Optimization
1. Perform image scanning, freeze the image and select a range of images for analysis; or select a
desired cine loop from the stored images.
Images from the current scan session (already in freeze mode) or from a saved image loop can
be used.
2. Clicking the “Tissue” or “Contrast”. Touch [Contrast QA] on the touch screen page to activate the
function.
3. Mark out the interested part (ROI).
If necessary, perform curve fitting on the time-intensity curve.
4. Analyze the parameters of the curve, or perform B measurement.
5. Save the curved image, export the data and do parameter analysis.
6. Click [Exit] on the touch screen to exit the contrast imaging QA.
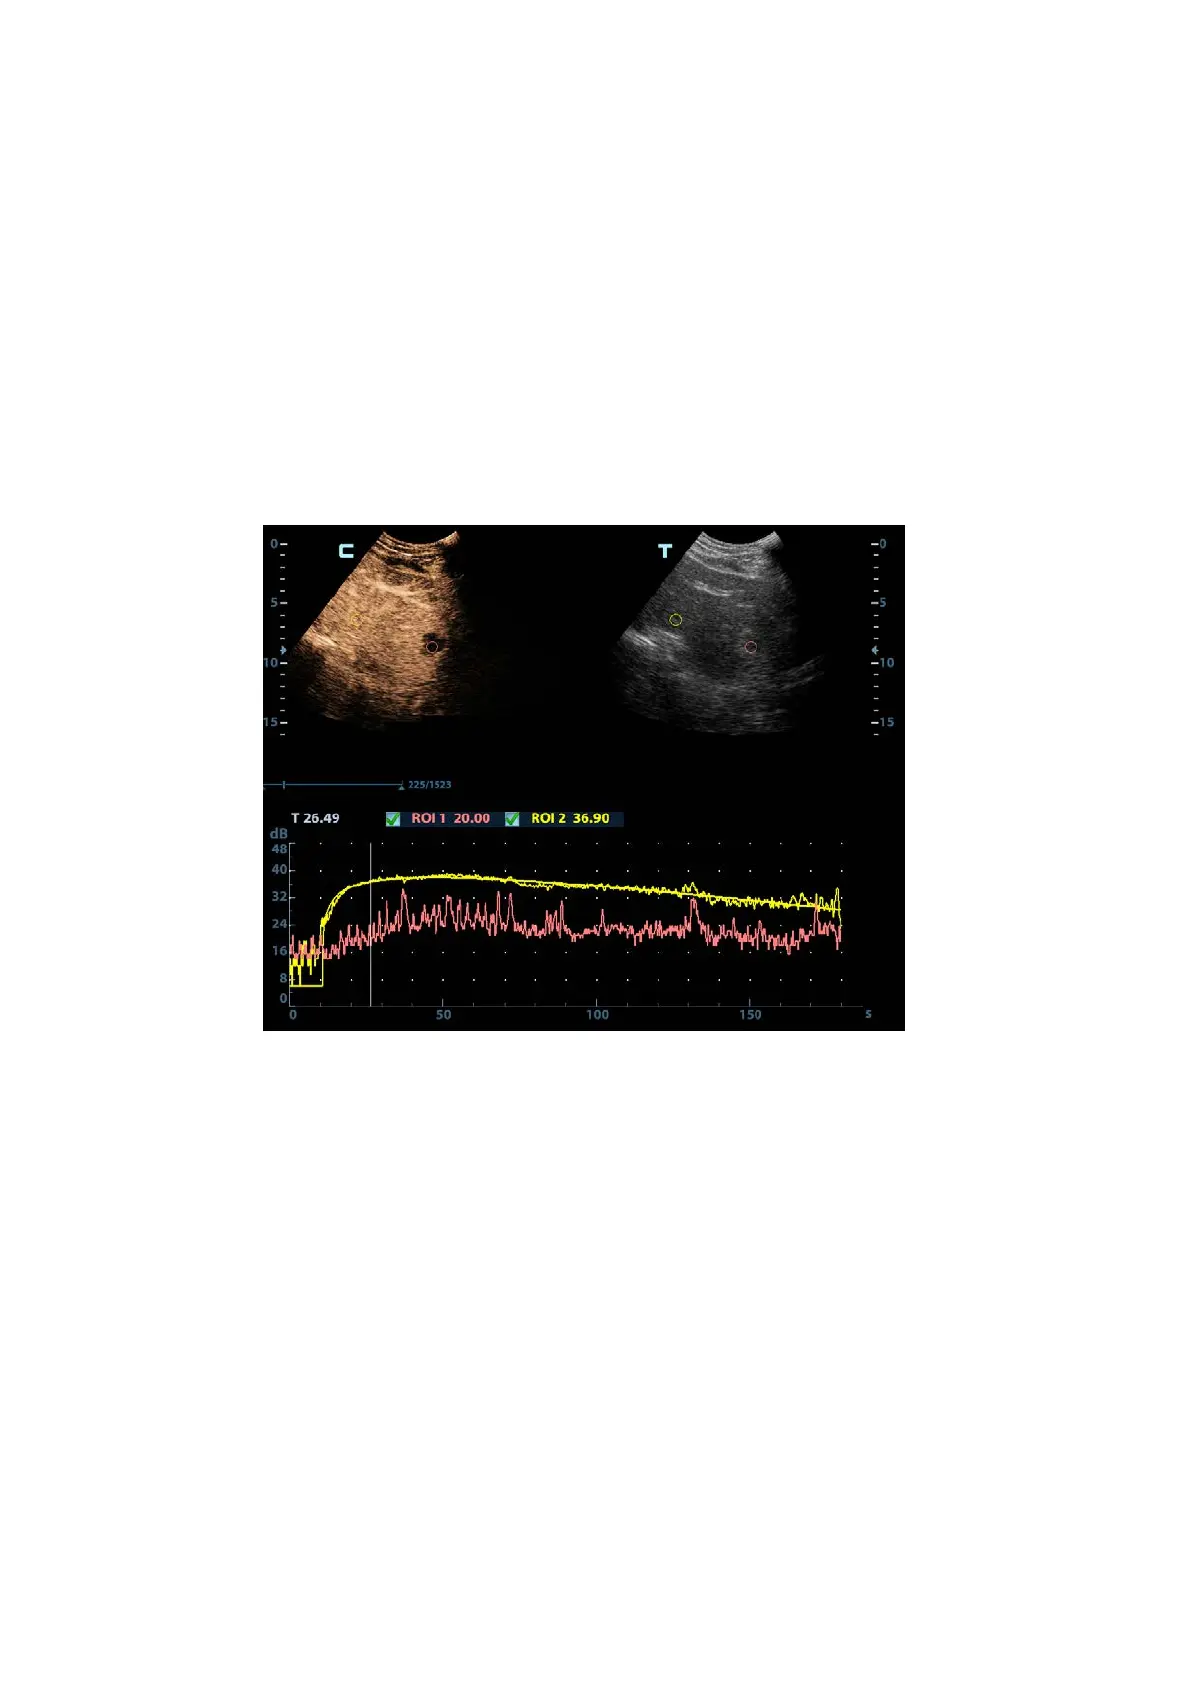
5.11.6.1 Contrast QA Screen
(For reference only)
1---Contrast cineloop window
Sample area: indicates sampling position of the analysis curve. The sample area is color-coded, 8
(maximum) sample areas can be indicated.
2---B Cineloop window
Sample areas are linked in the contrast cineloop window and B cineloop window.
3---Time-intensity curve
Y axis represents the intensity (unit: dB), while X axis represents the time (unit: s).
Frame marker: a white line that is perpendicular to the X axis, can be moved horizontally left to
right (right to left) by rolling the trackball.
Click the check box beside the ROI to set if to hide or to display the QA curve.
5.11.6.2 Basic Operations of Contrast QA
QA Analysis Image Range
The system set the starting time and ending time of the cine to be first frame and last frame of QA
analysis range.
 Loading...