Image Optimization 5-103
4. Touch [Start Tracking] on the touch screen to start the tracking function. Adjust the parameters if
necessary.
Touch [Edit] on the touch screen to display the free cursor. Roll the trackball and press <Set> to re-
select the trace reference points. Move the cursor to the exact boundary position and press <Set>
again to set the right place.
5. Touch [Accept & Compute] on the touch screen to calculate and display the curve. Adjust the
parameters if necessary.
6. Touch
on the touch screen to turn to the other page. Touch [Bull’s Eye] to see the result.
7. Touch [Data Export] on the touch screen to export analyzed data.
8. Touch [Exit] on the touch screen.
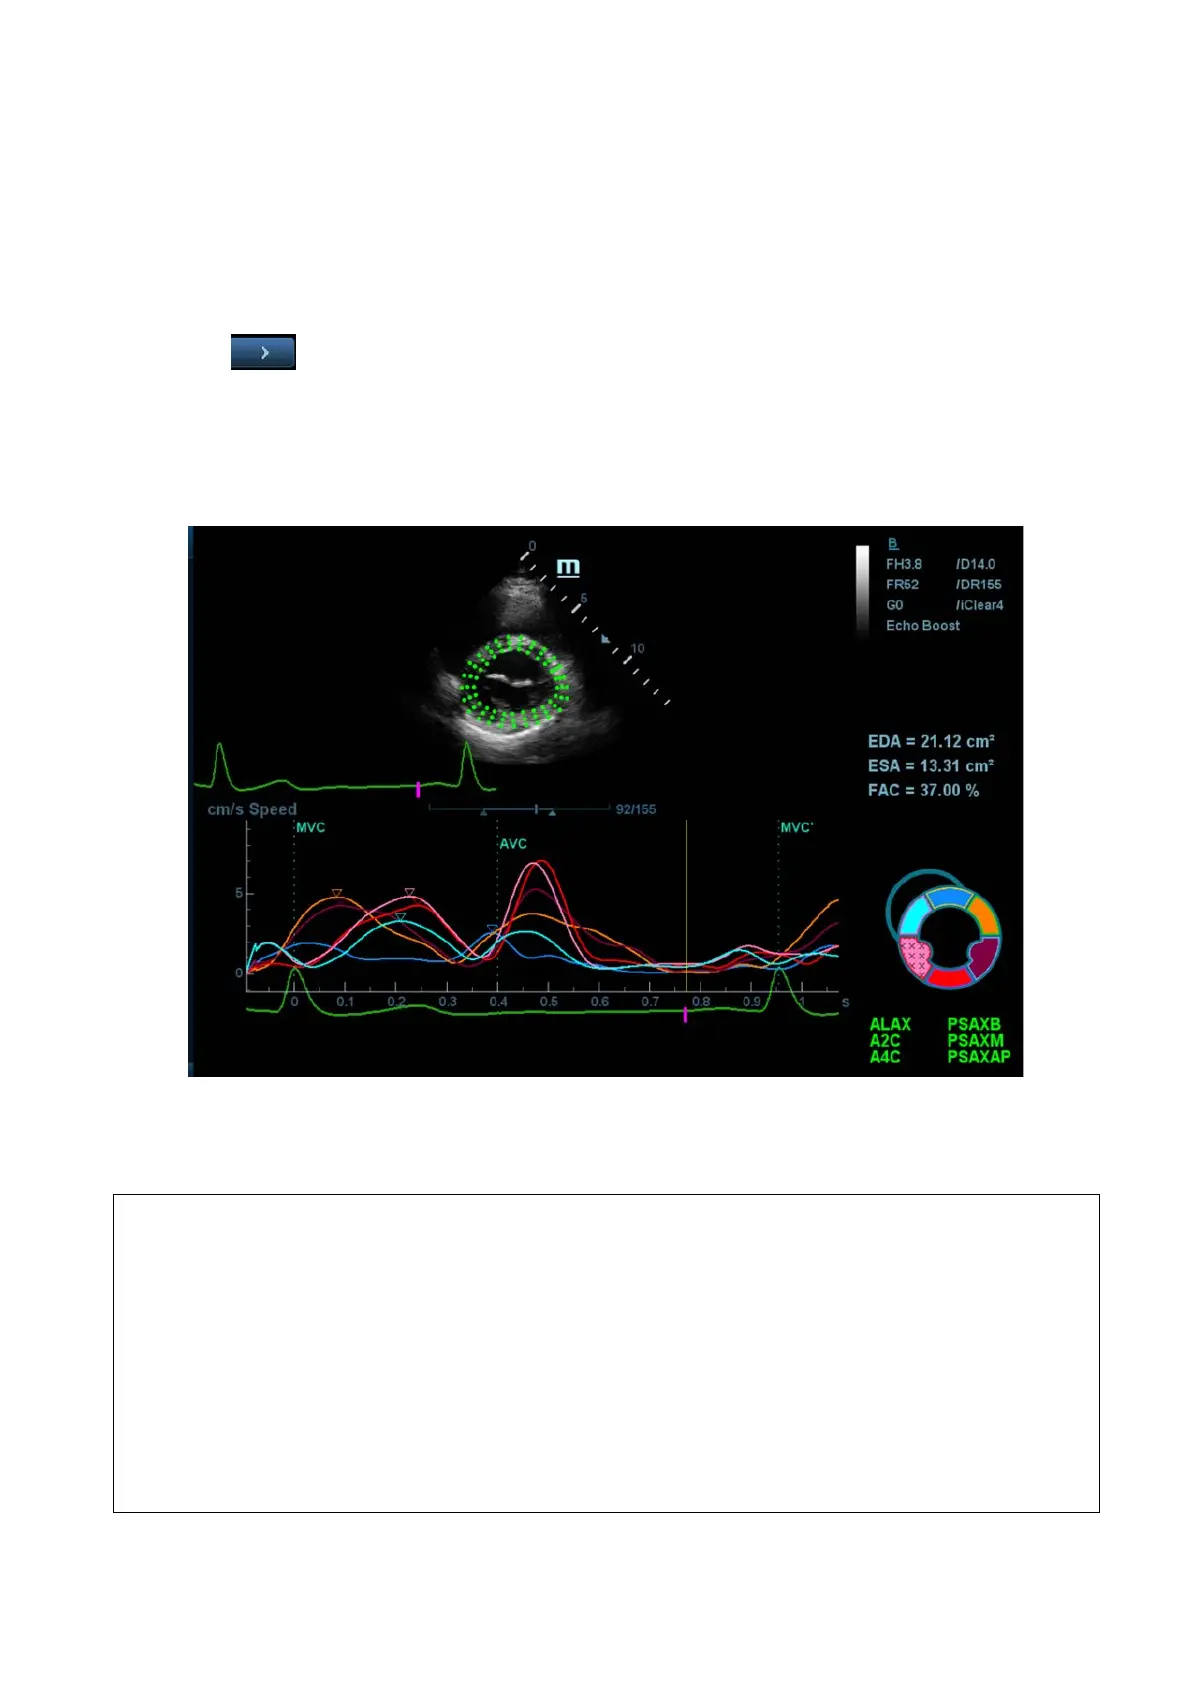
5.15.2 Tissue Tracking QA Screen Description
1 - Displays the image used to generate the trace curve
2 - Displays the ECG trace
3 - Displays the measurement and calculation results:
EDV:
maximum value of the end diastolic volume during the trace.
EDA:
maximum value of the end diastolic area (Left Ventricular) during the trace.
ESV:
maximum value of the end systolic volume (Left Ventricular) during the trace.
ESA:
maximum value of the end systolic area (Left Ventricular) during the trace.
FAC:
Fractional Area Change = (EDA - ESA)/EDA.
This parameter is available in the short axis section.
This parameter is available in the long axis section.
1
3
 Loading...