6–Managing Ports
Graphing Port Performance
59266-01 B 6-25
Loop Forever runs the test until you click Stop Test.
Loop Count runs the test a specified number of times.
7. Select a Test Pattern option: Accept the default test pattern, or select the
User-Defined option and enter a value.
8. Click Start Test to begin the test. Observe the results in the Test Results
area.
Graphing Port Performance
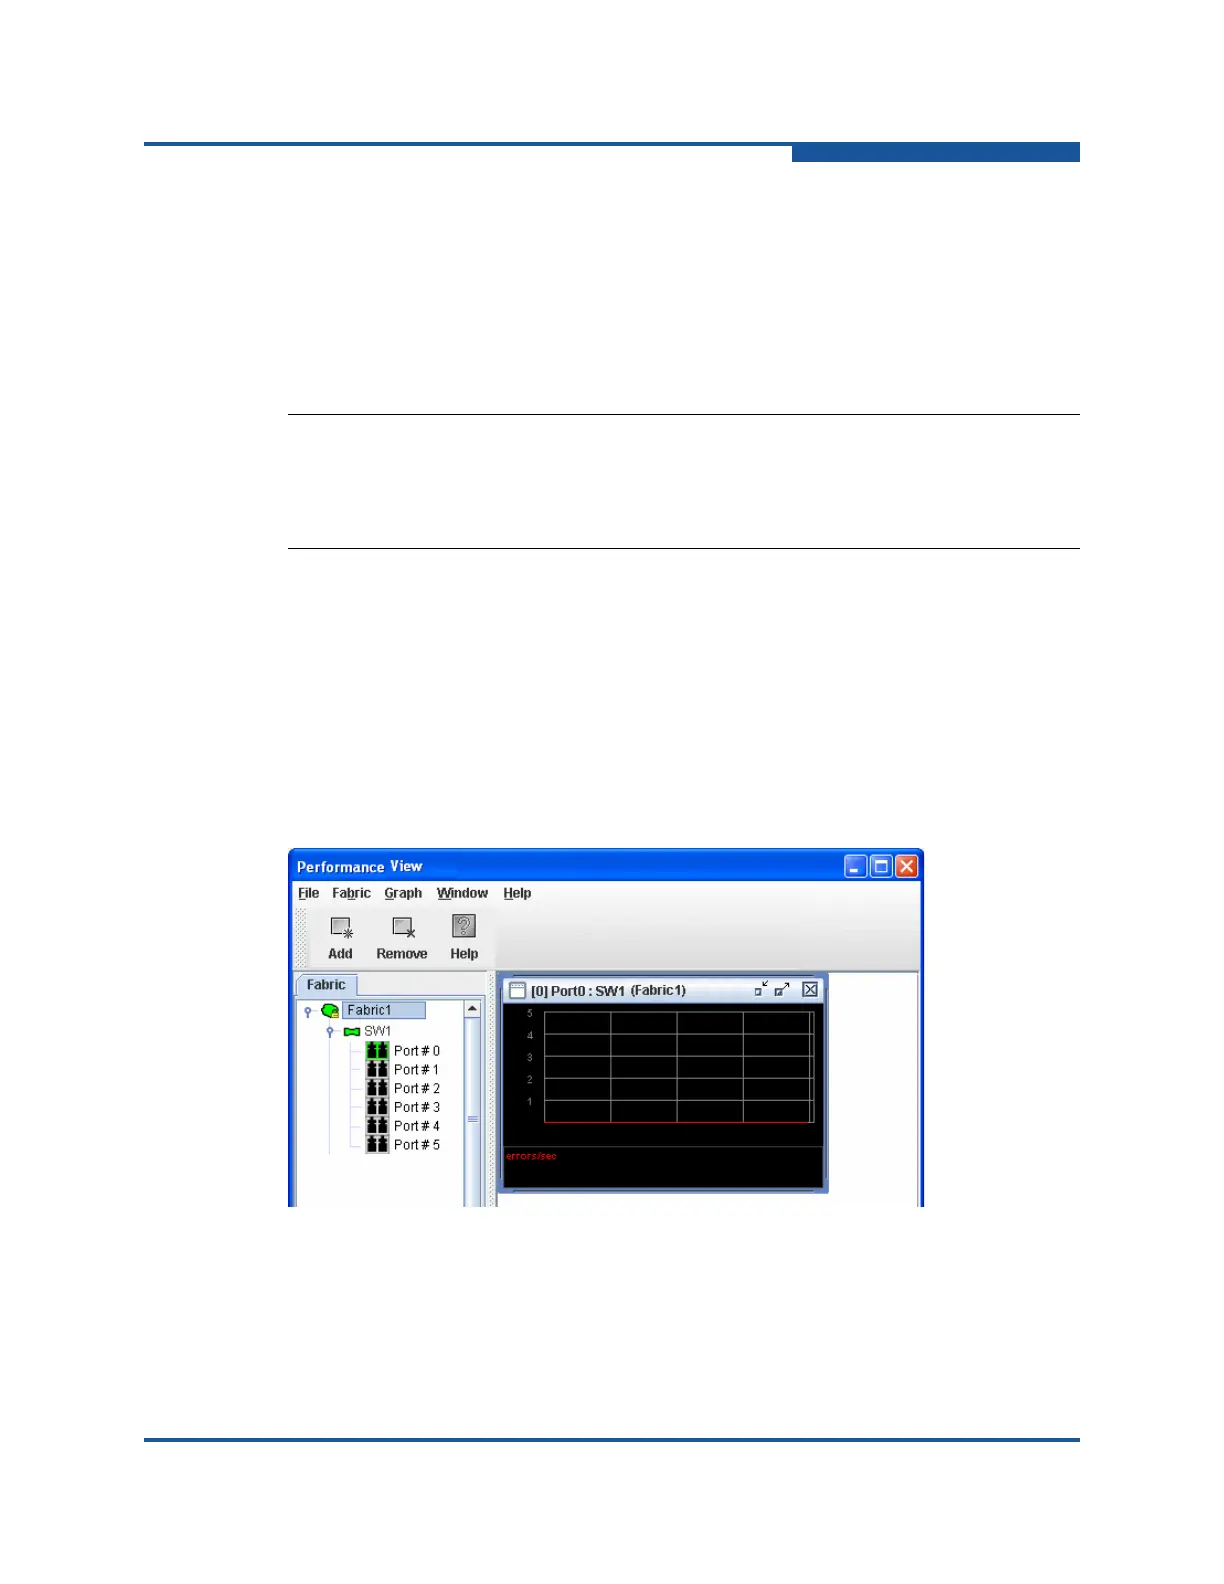
The Performance View application displays port performance using graphs,
plotting data communication rates and total errors for selected ports (Figure 6-9).
When plotting data communication rates, you can choose frames/second or
KBytes/second. The maximum number of open graphs is 64.
The fabric status appears in text format after the fabric name in the fabric tree.
The color of the icon indicates the current connection status as normal (green),
warning (yellow), critical (red), or unmanageable (blue).
Figure 6-9. Performance View Graph
The following sections describe how to use Performance View.
Starting Performance View
To start Performance View from within Enterprise Fabric Suite:
NOTE:
If the Test Status field in the Test Results area indicates Failed, note the Test
Fault Code displayed in the Port Information data window and contact your
authorized maintenance provider.
 Loading...