6–Managing Ports
Graphing Port Performance
59266-01 B 6-29
To change this polling frequency:
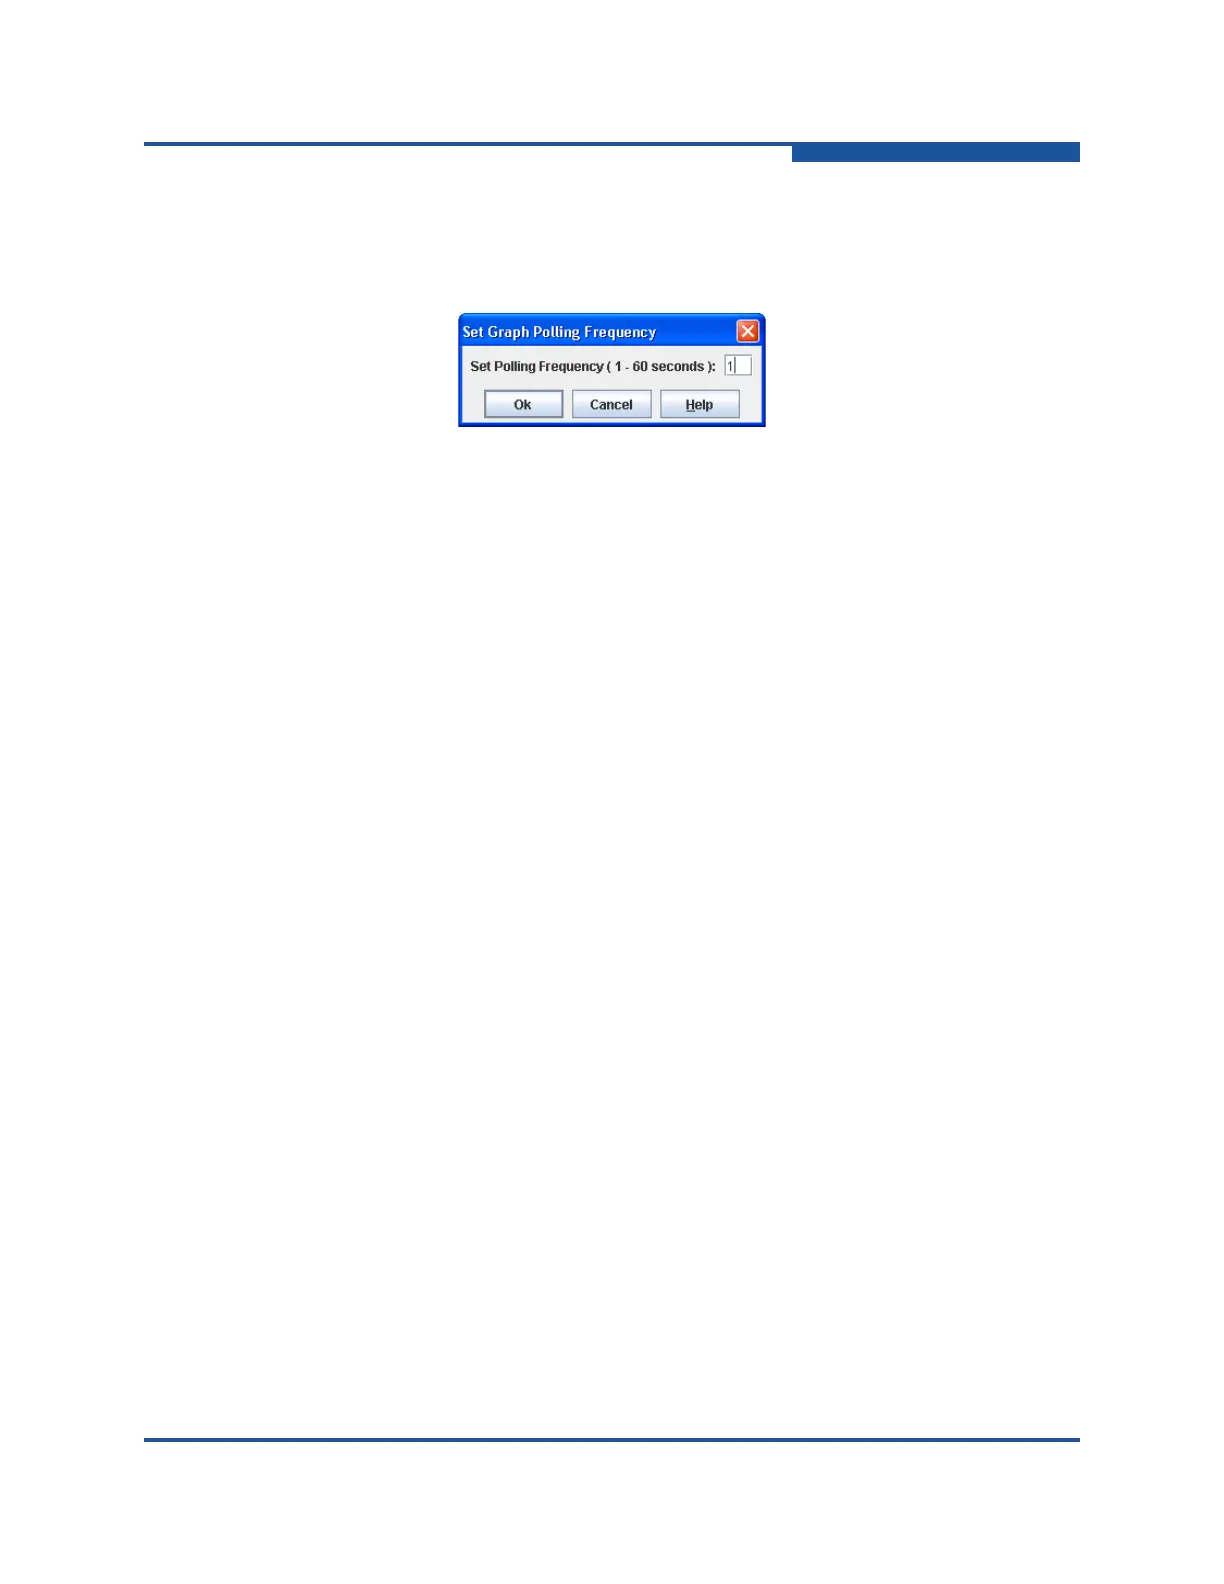
1. On the Graph menu, click Set Polling Frequency to view the Set Graph
Polling Frequency dialog box (Figure 6-13).
Figure 6-13. Set Graph Polling Frequency Dialog Box
2. Enter the new polling interval in seconds [1–60]. Performance View updates
the graphs once during the interval. For example, setting the polling
frequency to five seconds returns one second’s worth of data every five
seconds.
3. Click OK to save the changes.
Displaying Graphs
You can open a maximum of 64 graphs at one time. To display graphs:
1. On the Fabric menu, click Add Fabric, or click Add to view the Add a New
Fabric dialog box.
2. Enter a fabric name, an IP address, an account name, and a password, and
then click OK.
3. Set the graphing options and polling frequency. By default, Performance
View plots total bytes transmitted and received at a polling frequency of once
per second. For information about modifying performance graphs, see
“Customizing Graphs” on page 6-30.
4. You can display graphs in the following ways:
Click on a switch entry handle, and select one or more ports.
Right-click on a switch icon in the fabric tree, and select Open Graph
for All Logged-In Ports from the drop-down list.
You can move graphs around individually by clicking and dragging, or you can
arrange them as a group. For more information, see “Arranging Graphs in the
Display” on page 6-30.
To remove a graph, click the graph’s X button. To remove all graphs, on the
Window menu, click Close All.
To remove a fabric and its graphs:
 Loading...