2–Managing Fabrics
Transparent Routes Data Window
2-22 59266-01 B
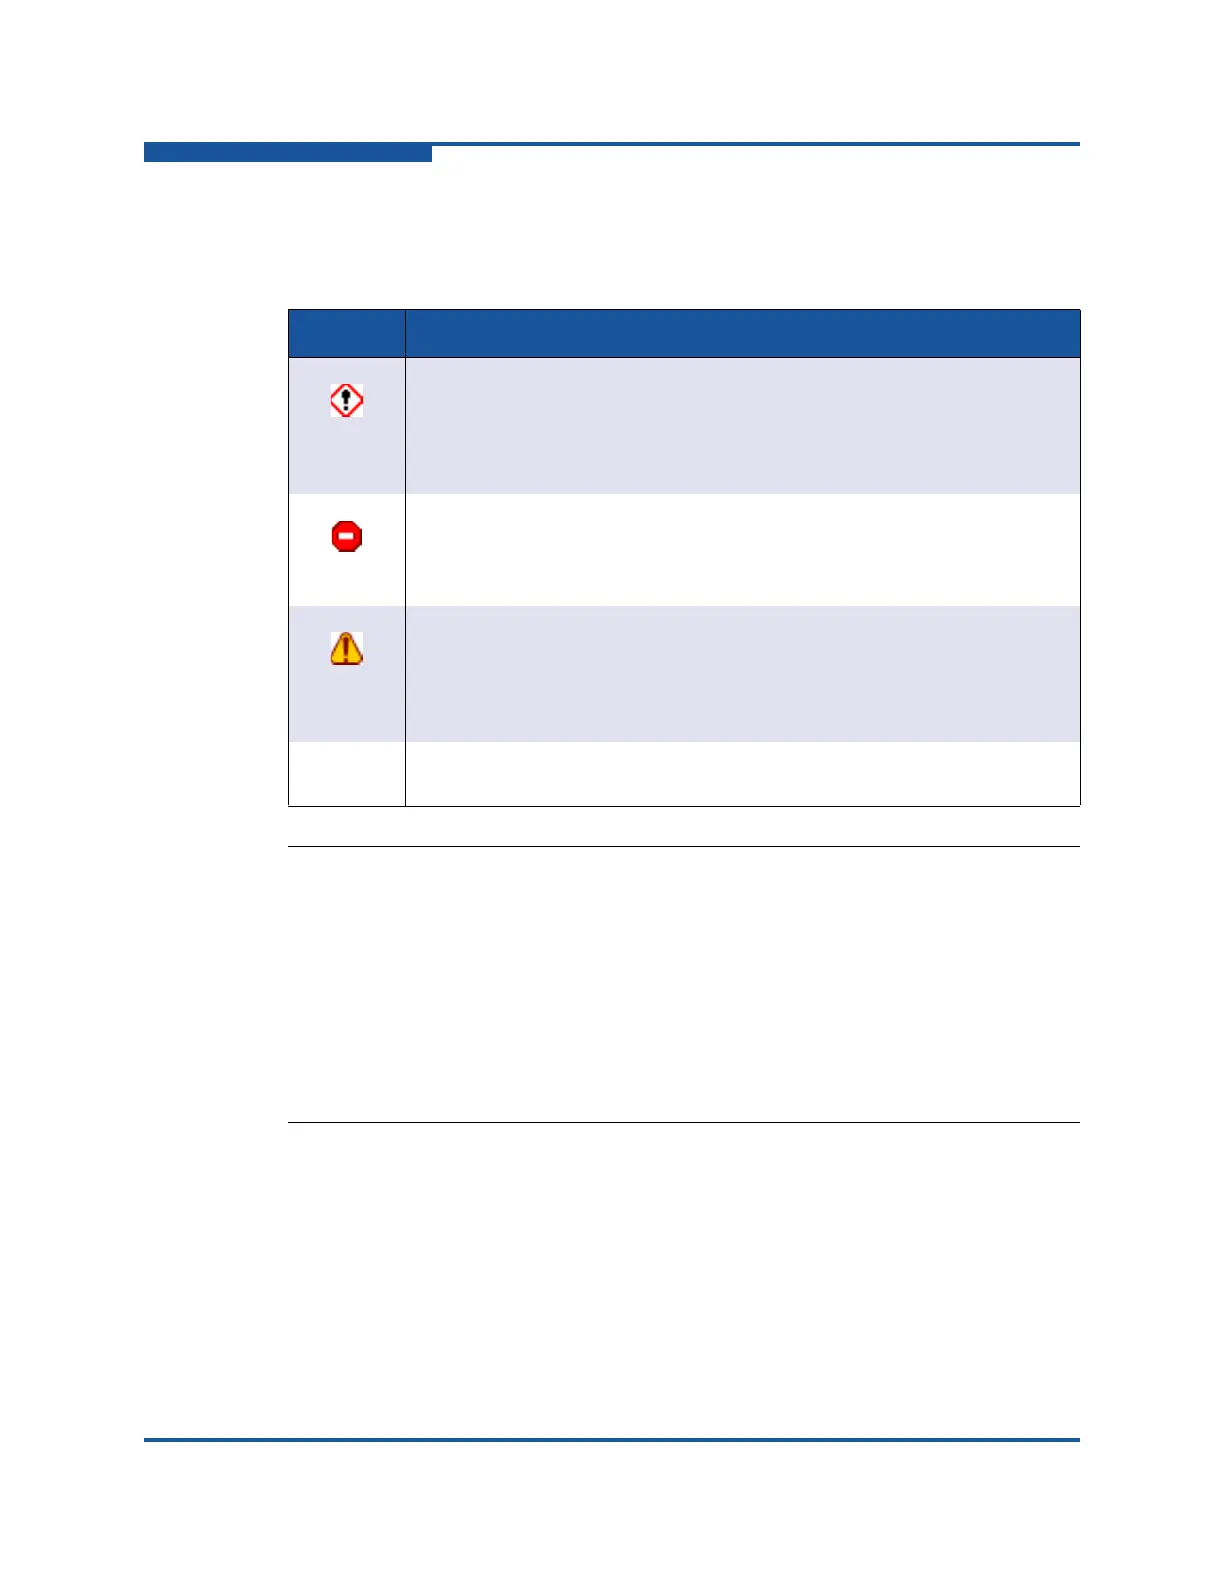
The icons in the Severity column identify the operational state of the port, as
described in Table 2-3.
Filtering the Event Browser
Filtering the Event Browser enables you to display only those events that are of
interest based on the event severity, timestamp, source, type, and description. To
filter the Event Browser, on the Filter menu, click Filter Entries. This opens the
Filter Events dialog box (Figure 2-10). The Event Browser displays those events
that meet all of the criteria in the Filter Events dialog box. If the filtering criteria are
cleared or changed, then all the events that were previously hidden that satisfy the
new criteria are shown.
Table 2-3. Port Operational States
State Description
Alarm—a serviceable event. This means that attention by the user or field
service is required. Alarms are posted asynchronously to the screen and
cannot be turned off. If the alarm indicates that a system error has
occurred, the customer may be directed to provide the support file from
the switch.
Critical event—indicates a potential failure. Critical log messages are
events that warrant notice by the user. By default, these log messages are
posted to the screen. Critical log messages do not have alarm status as
they require no immediate attention from a user or service representative.
Warning event—indicates errors or other conditions that may require
attention to maintain maximum performance. Warning messages are not
be posted to the screen unless the log is configured to do so. Warning
messages are not disruptive and therefore, do not meet the criteria of Crit-
ical. The user need not be informed asynchronously
No icon Informative—an unclassified event that provides only supporting informa-
tion.
NOTE:
Events (Alarms, Critical, Warning, and Informative) generated by Enterprise
Fabric Suite are not saved on the switch. They are permanently discarded
when you close an Enterprise Fabric Suite session; however, you can save
these events to a file on the workstation before you close Enterprise Fabric
Suite and read it later with a text editor or browser.
Events generated by the switch are stored on the switch, and are retrieved
when Enterprise Fabric Suite is restarted. Some alarms are configurable.
 Loading...