2–Managing Fabrics
Transparent Routes Data Window
59266-01 B 2-21
Event Browser
The Event Browser displays a list of events generated by the switches in the fabric
and the Enterprise Fabric Suite application. Events that are generated by the
Enterprise Fabric Suite application are not saved on the switch, but can be saved
to a file (.xml, .csv, .txt) during an Enterprise Fabric Suite session.
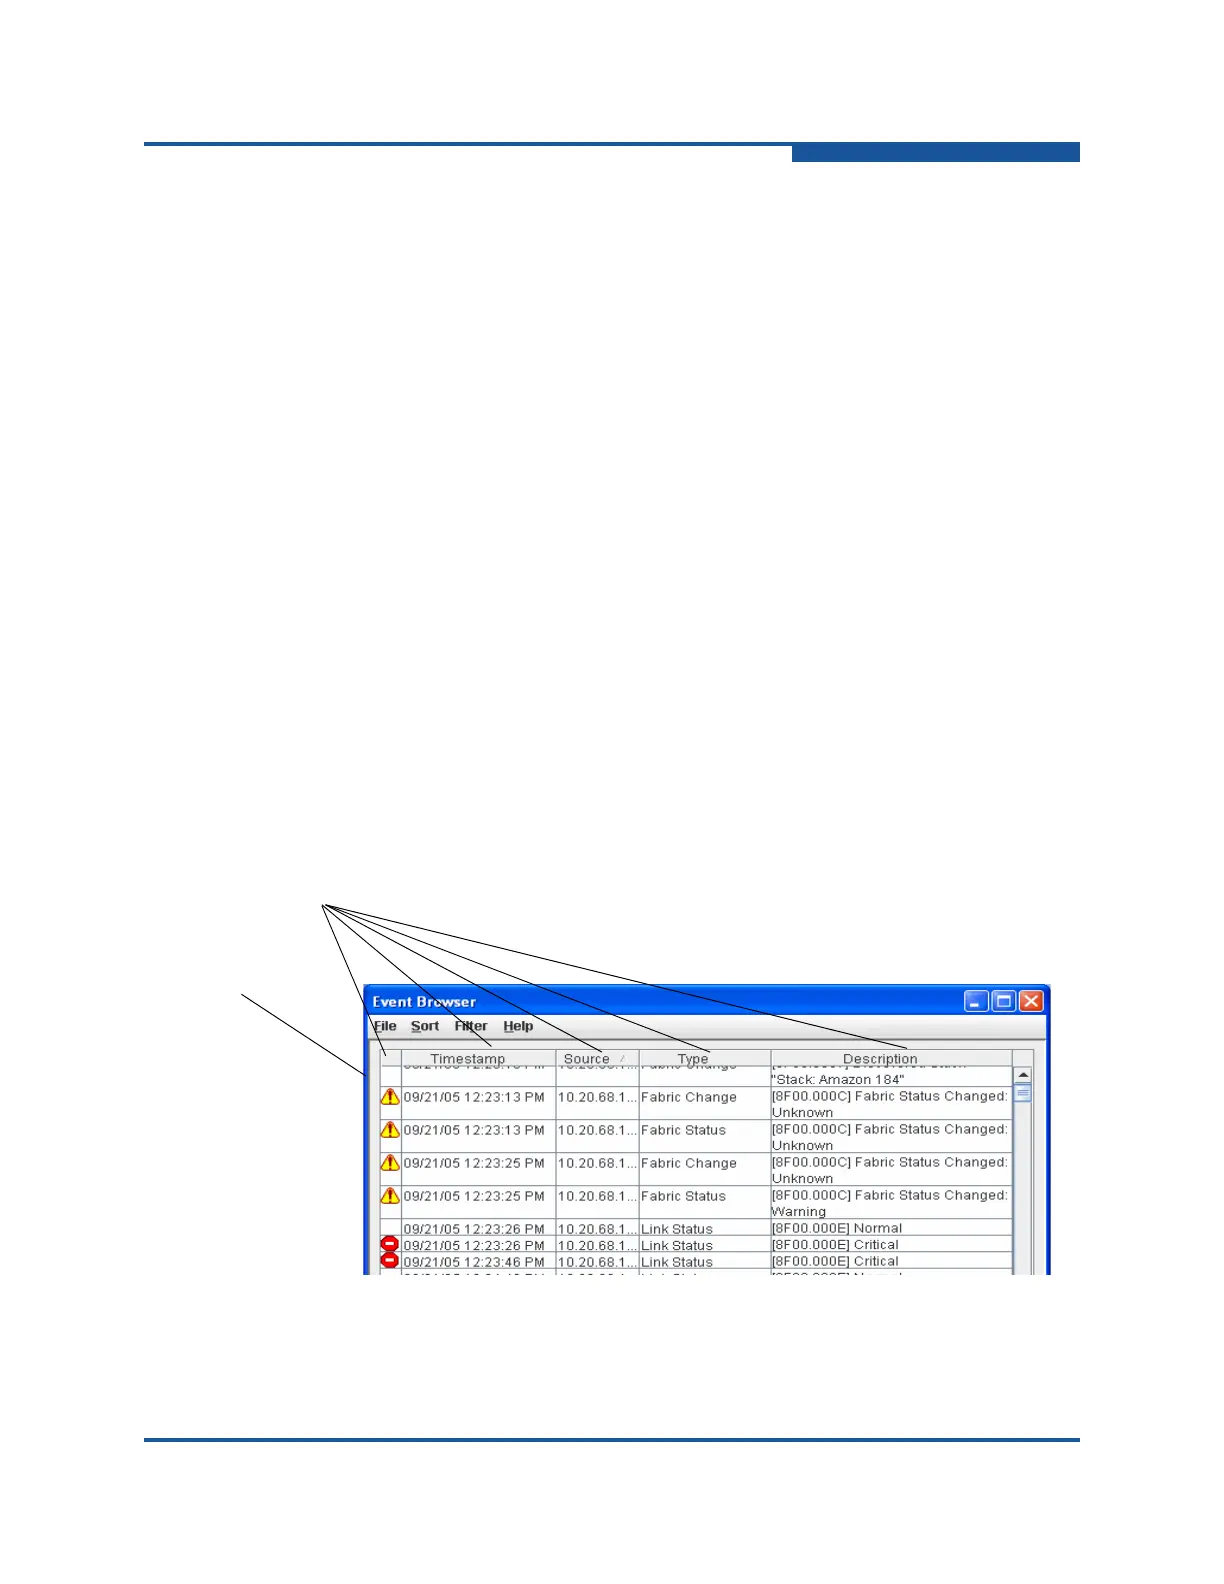
The Event Browser (Figure 2-9) lists events that have occurred, displaying the
severity, time, source, type, and description of the events. The maximum number
of entries allowed in the Event Browser is 10,000. The maximum number of
entries allowed on a switch is 1,200. Once the maximum is reached, the oldest
events in the event list are deleted when new events occur. Event entries from the
switch use the switch time stamp, while event entries generated by Enterprise
Fabric Suite have a workstation time stamp. You can filter, sort, and export the
contents of the Event Browser to a file. The Event Browser begins recording when
it is enabled and Enterprise Fabric Suite is running.
If the Event Browser is enabled using the Preferences dialog box, the next time
Enterprise Fabric Suite is started all events from the switch log appear. If the
Event Browser is disabled when Enterprise Fabric Suite is started and later
enabled, only those events that occur after the time the Event Browser was
enabled will appear.
To display the Event Browser, on the Fabric menu, click Show Event Browser. If
the Show Event Browser selection is grayed-out, you must first enable the Events
Browser preference. See “Setting Enterprise Fabric Suite Preferences” on
page 1-9.
Figure 2-9. Event Browser Dialog Box
Column sorting
buttons
Severity
column
 Loading...