Monitoring
Instructions for Use Apollo SW 4.5n 175
Part Number: 9053586, 3rd edition
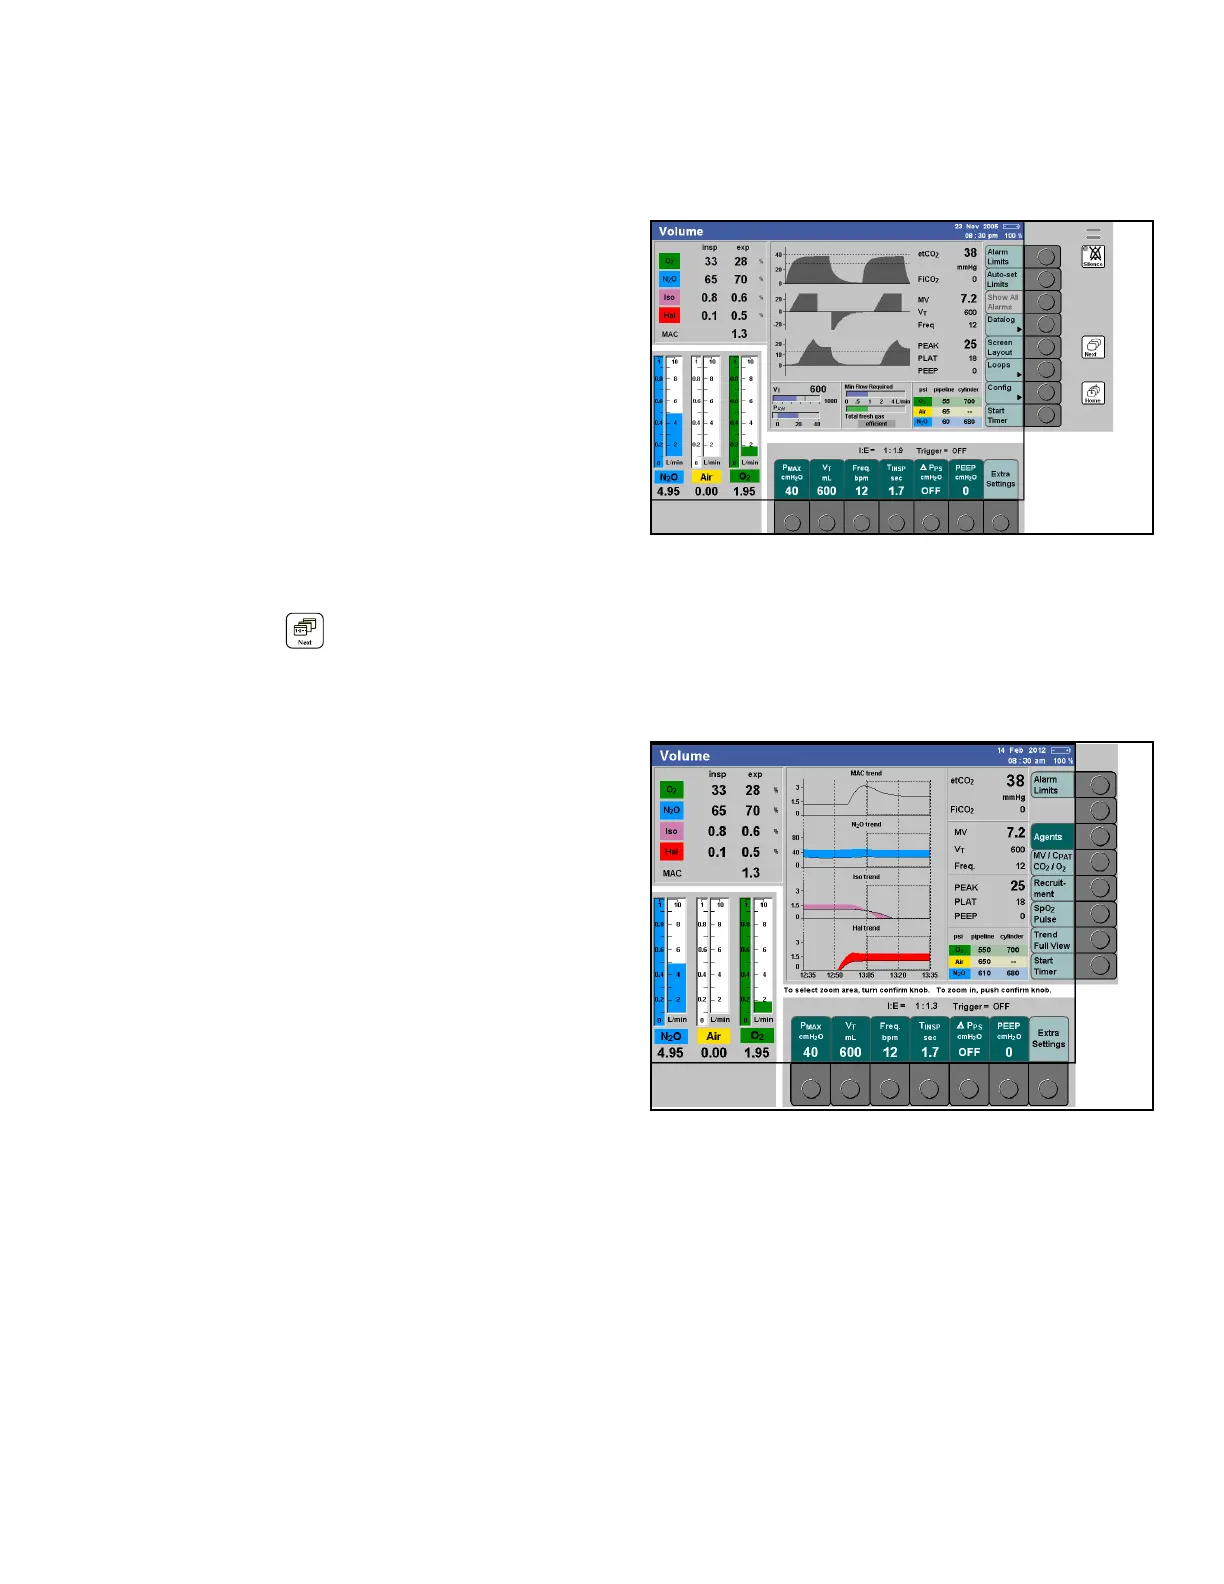
Trend screen
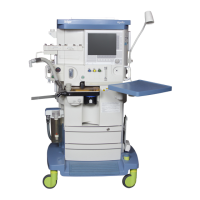
Figure 102. Location of Next KeyDisplays the measured values over an interval
beginning with the start of the measurement.
The maximum storage time is eight hours, data older
than eight hours is erased.
It displays up to four graphical trends on the screen
at one time (see Figure 103).
The following trend combinations can be selected:
– Agents (MAC, N
2O, primary agent, secondary
agent)
– MV/C
PAT/CO2/O2
– Recruitment (optional)
CPAT/PEEP trend / MV*CO
2 trend /
O
2 Uptake trend
– SpO
2 pulse (optional)
1. Press the > < key repeatedly until the trend
screen is displayed (1 in Figure 102).
Figure 103. Trend Screen - Agent Trends ShownSelecting other display combinations
1. Press the required button:
>Agents< (1 in Figure 103),
>MV/C
PAT/CO2/O2< (2 in Figure 103),
>Recruitment< (3 in Figure 103)
or
>SpO
2 Pulse< (4 in Figure 103)
The >SpO
2 Pulse< button appears only if the
data is available.
The trend for inspiratory and expiratory values is
represented by bar graphs. The expiratory value is
always indicated by a black line.
The trends for agents, N
2O, and O2 are displayed
with the relevant color coding.
Zoom function
The zoom function allows the user to magnify a
portion of the trend display. It becomes available
after 30 minutes of trend data is collected.
The zoom window appears as a rectangle on the
trend. The rectangle can be moved by the user to
select the area to magnify.
 Loading...