Measurement setups Set up measurement statistics
Set up measurement statistics
From the Measure menu, highlight Statistics; then select Statistics Controls from the submenu, or click the
Statistics button in the Measurement Setup window.
Overview
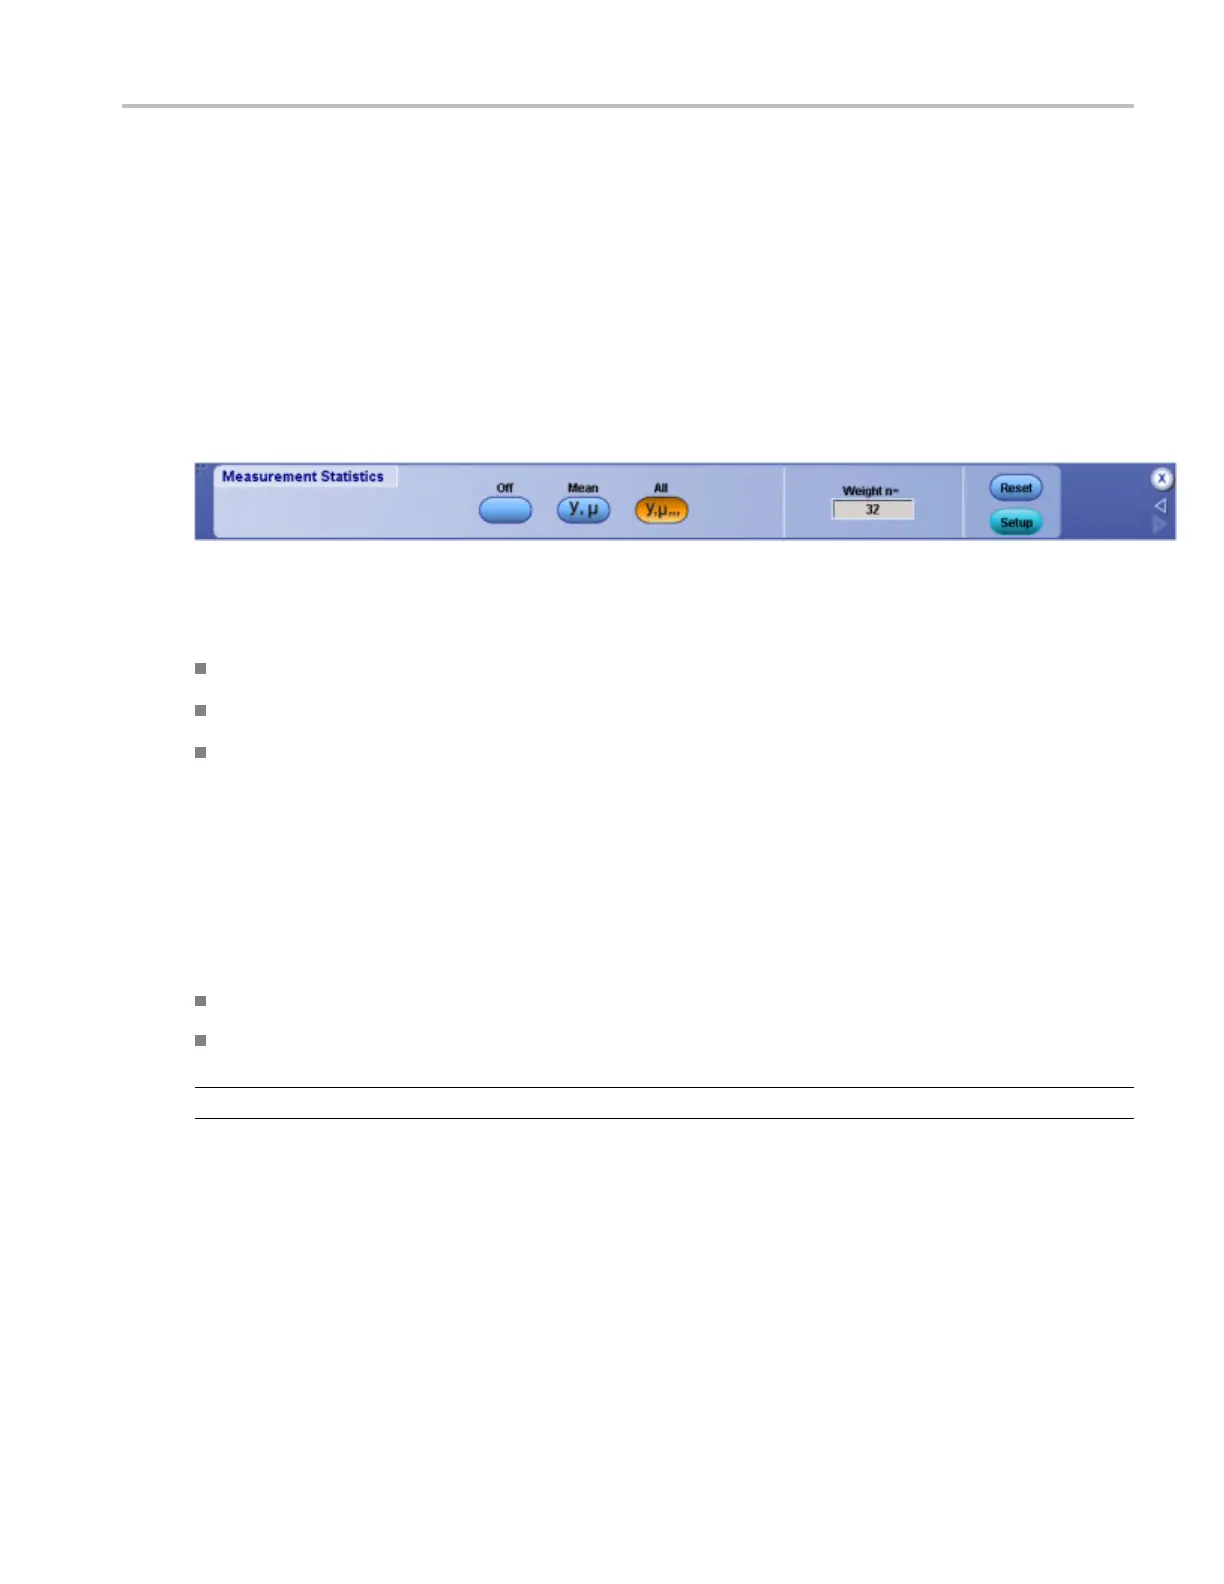
Use the Meas
urement Statistics control window to display statistical calculations on measurements. The
control window contains controls that determine which statistics are displayed in the measurement window.
To use
Click Off to turn the measurement statistics display off.
Click Mean to display the value and the m ean (µ) of each measurement.
Click All to display the statistics for each measurement value.
(µ) Mean
(m) Minimum
(M) Maximum
(s) Standard Deviation
(n) Population
Click in the Weight entry box, and then use the multipurpose knobs to set the statistics weight.
Click Reset to restart the statistics calculations.
TIP. Select the individual statistics directly from the Measure menu Statistics submenu.
Behavior
Measurement values continue as live updates while the statistics accumulate over time. The statistics
appear on the main screen when a control window is open or on the right side of the screen when no
control windows are open and t here are less than four measurements active. The color of the statistics
match the color of the waveform from which the measurement was taken.
The statistics weight specifies the constant used to calculate the mean and standard deviation; the minimum
and maximum values are unaffected by weighting. A large value produces statistics that vary less over time.
DSA/DPO70000D, MSO/DPO/DSA70000C, DPO7000C, and MSO/DPO5000 Series 285
 Loading...