How to ? Define a spectral math waveform
8. Select the appropriate FFT window type.
9. Set the Vertical Scale and Reference as appropriate.
Aliasing
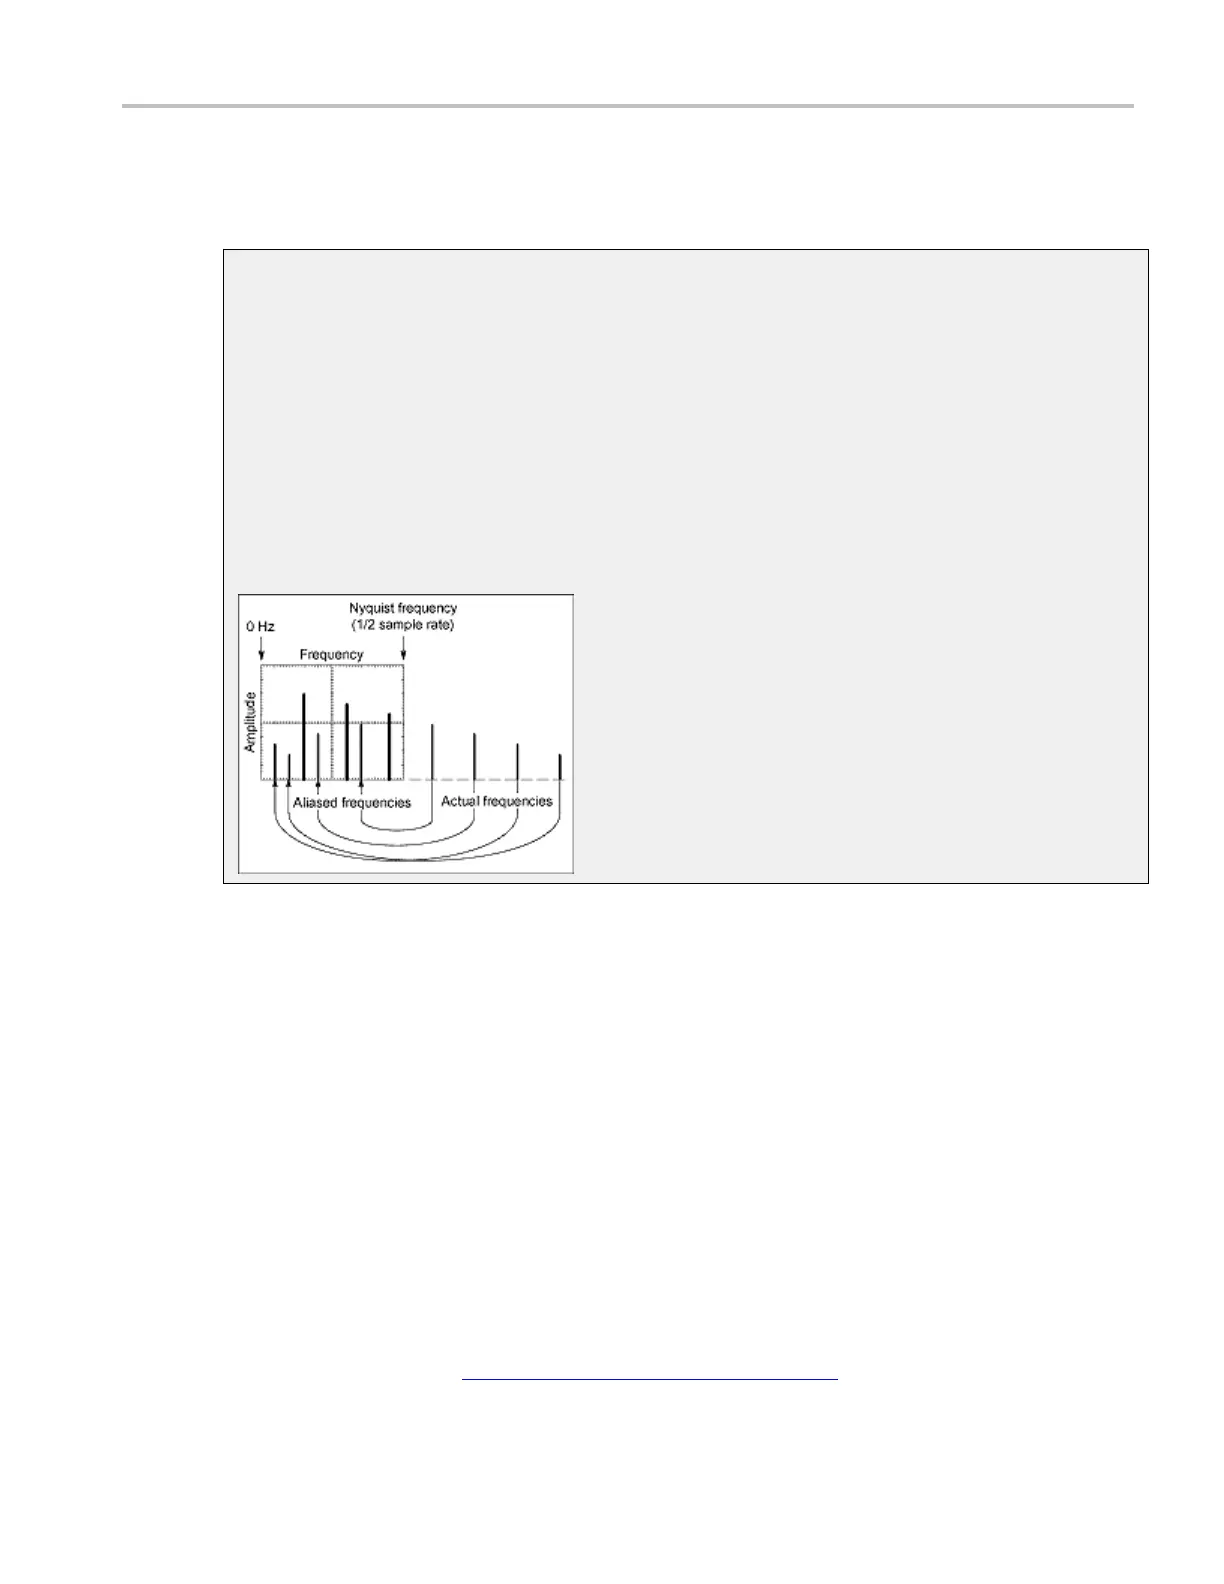
Problems occur when the instrument acquires a signal containing frequency components that are
higher in frequency than the Nyquist frequency. The Nyquist frequency is the highest frequency that
any digital oscilloscope can measure without errors is one-half of the sample rate or frequency.
The frequency components that are above the Nyquist frequency are under sampled and appear to
"fold back" around the Nyquist frequency, showing as lower frequency components. These incorrect
components are called aliases.
To quickly check for aliasing, slowly decrease the horizontal time scale. If the shape of the displayed
waveform changes drastically or becomes stable, your waveform is probably aliased. You can also
check for aliasing by turning on peak d etect acquisition mode. To remove aliasing, modify the
record length.
Define a spectral math waveform
Use the following procedure to define a spe ctral math waveform. Before you begin, ensure that the
sources you will use are either acquiring or have acquired data. These sources do not have to be displayed
to be used.
1. All sources that you will use in your math waveform must be available.
2. From the toolbar, click the Math button to open the Math Setup control window
.
3. Click a Math <1–4> tab to select the math waveform you want to create.
4. Under Spectral Analysis, click Advanced to open the Spectral Analysis - Advanced control window.
5. Open the Create/Edit tab.
6. Click Ma gnitude to create a magnitude spectral waveform or Phase to create a phase spectral
waveform. If you want an averaged spectral waveform, click Avgs to set the number of averages. See
the step Apply Averaging Creating a Math Waveform
(see page 612) for details.)
DSA/DPO70000D, MSO/DPO/DSA70000C, DPO7000C, and MSO/DPO5000 Series 623
 Loading...