EasyManuals Logo
Home>D-Link>Switch>xStack DGS-3120 Series

D-Link xStack DGS-3120 Series Reference Guide

D-Link xStack DGS-3120 Series
509 pages
To Next Page IconTo Next Page
To Previous Page IconTo Previous Page
Page #454 background imageLoading...
Page #454 background image
xStack® DGS-3120 Series Layer 3 Managed Gigabit Ethernet Switch Web UI Reference Guide
444
default value is one second.
Record Number Select number of times the Switch will be polled between 20 and 200. The default
value is 200.
Show/Hide
Check whether or not to display Port Util.
Click the Apply button to accept the changes made for each individual section.
Statistics
Port Statistics
Packets
The Web manager allows various packet statistics to be viewed as either a line graph or a table. Six windows are
offered.
Received (RX)
To select a port to view these statistics for, select the port by using the Port drop-down menu. The user may also
use the real-time graphic of the Switch at the top of the web page by simply clicking on a port.
To view this window, click Monitoring > Statistics > Port Statistics > Packets > Received (RX) as shown below:
Figure 11-4 Received (RX) window (for Bytes and Packets)
Click the View Table link to display the information in a table rather than a line graph.
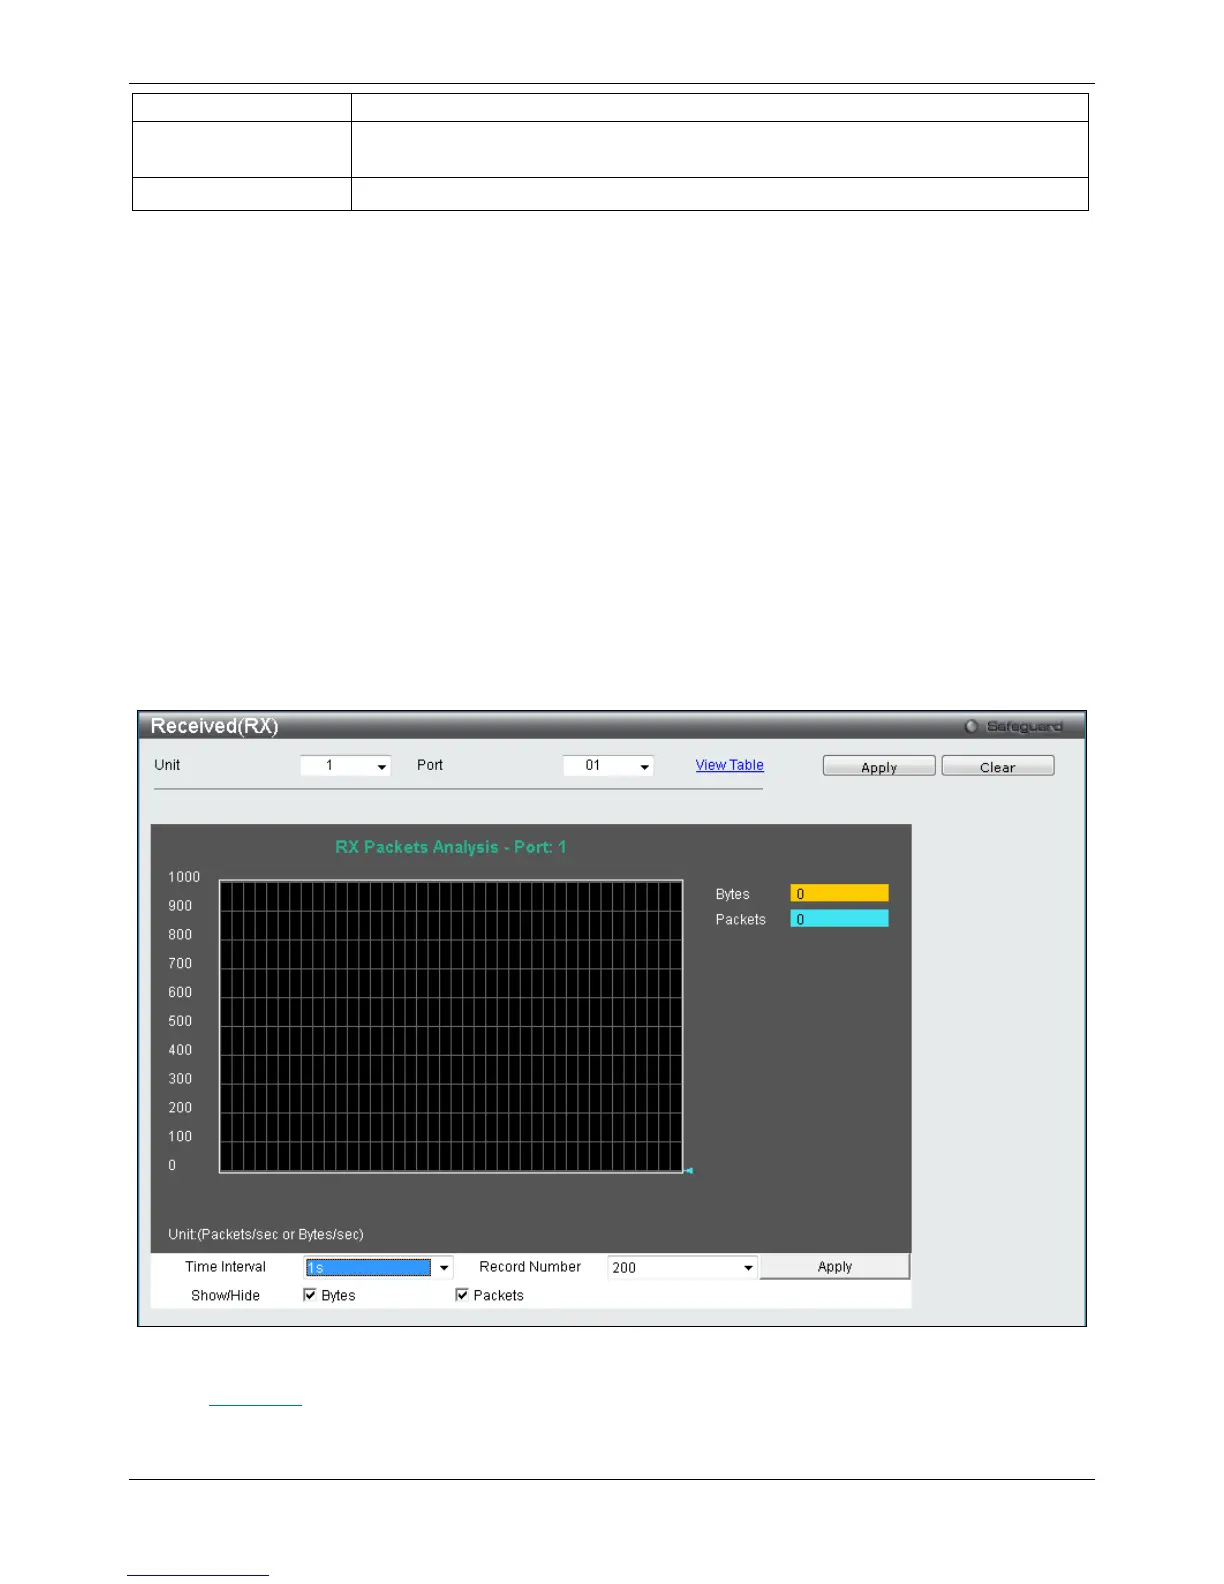
Table of Contents

Other manuals for D-Link xStack DGS-3120 Series

Questions and Answers:

Question and Answer IconNeed help?

Do you have a question about the D-Link xStack DGS-3120 Series and is the answer not in the manual?

D-Link xStack DGS-3120 Series Specifications

General IconGeneral
BrandD-Link
ModelxStack DGS-3120 Series
CategorySwitch
LanguageEnglish

Related product manuals