System Status Viewing operational history
FortiGate Version 4.0 MR1 Administration Guide
01-410-89802-20090903 129
http://docs.fortinet.com/ • Feedback
10 Update antivirus and attack definitions.
For information about antivirus and attack definitions, see “To update antivirus and
attack definitions” on page 329.
Viewing operational history
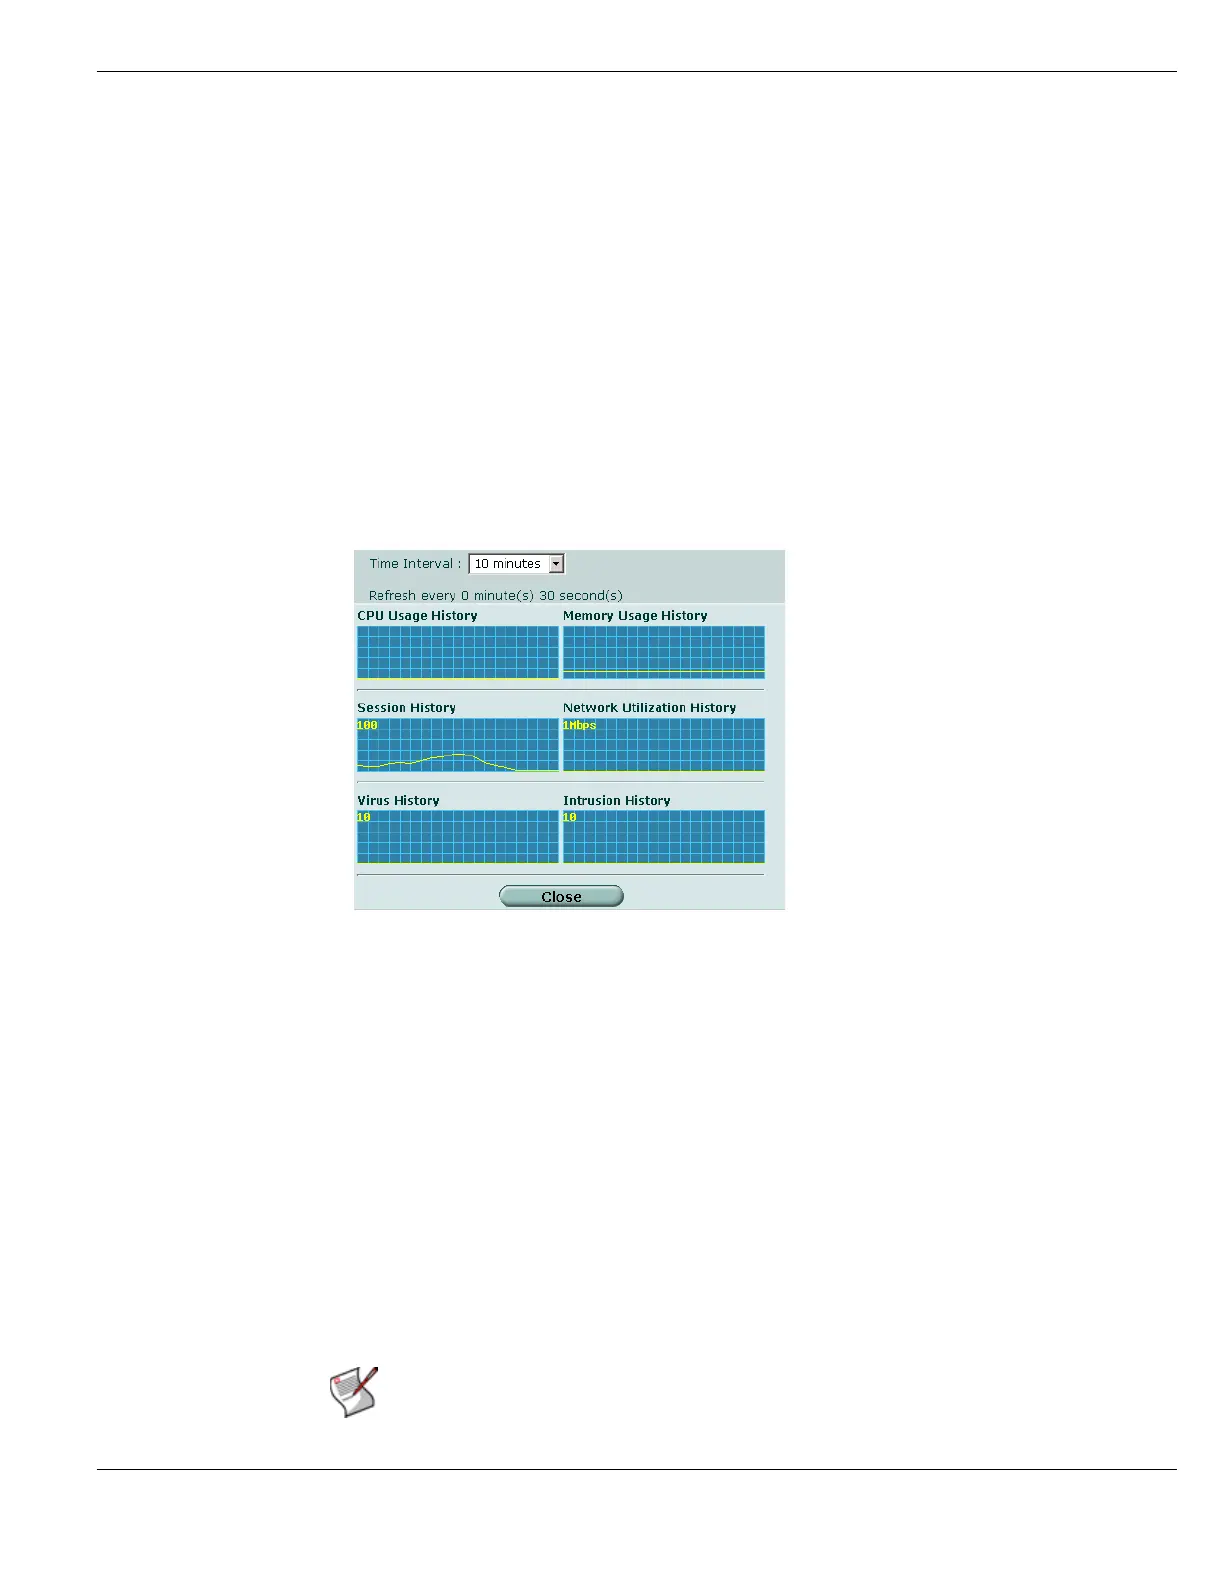
The System Resource History page displays six graphs representing different system
resources and protection activity over time.
Note the refresh rate is 3 second intervals for the graphs.
To view the operational history
1 Go to System > Status > Dashboard.
2 Select History in the upper right corner of the System Resources widget.
Figure 46: Sample system resources history
Manually updating FortiGuard definitions
You can update your FortiGuard antivirus database, Intrusion Protection definitions, and
antispam rule set at any time from the License Information section of the System Status
page.
Time Interval Select the time interval for the graphs to display.
CPU Usage History CPU usage for the preceding interval.
Memory Usage History Memory usage for the preceding interval.
Session History Number of sessions over the preceding interval.
Network Utilization History Network utilization for the preceding interval.
Virus History Number of Viruses detected over the preceding interval.
Intrusion History Number of intrusion attempts detected over the preceding
interval.
Note: For information about configuring automatic FortiGuard updates, see “Configuring
FortiGuard Services” on page 322.
 Loading...