GE Healthcare Senographe DS
Revision 1 Service Information and Procedures Class A 2385072-16-8EN
Senographe Operations - How to...
Page no. 125 Chapter 3
S2100D How To.fm
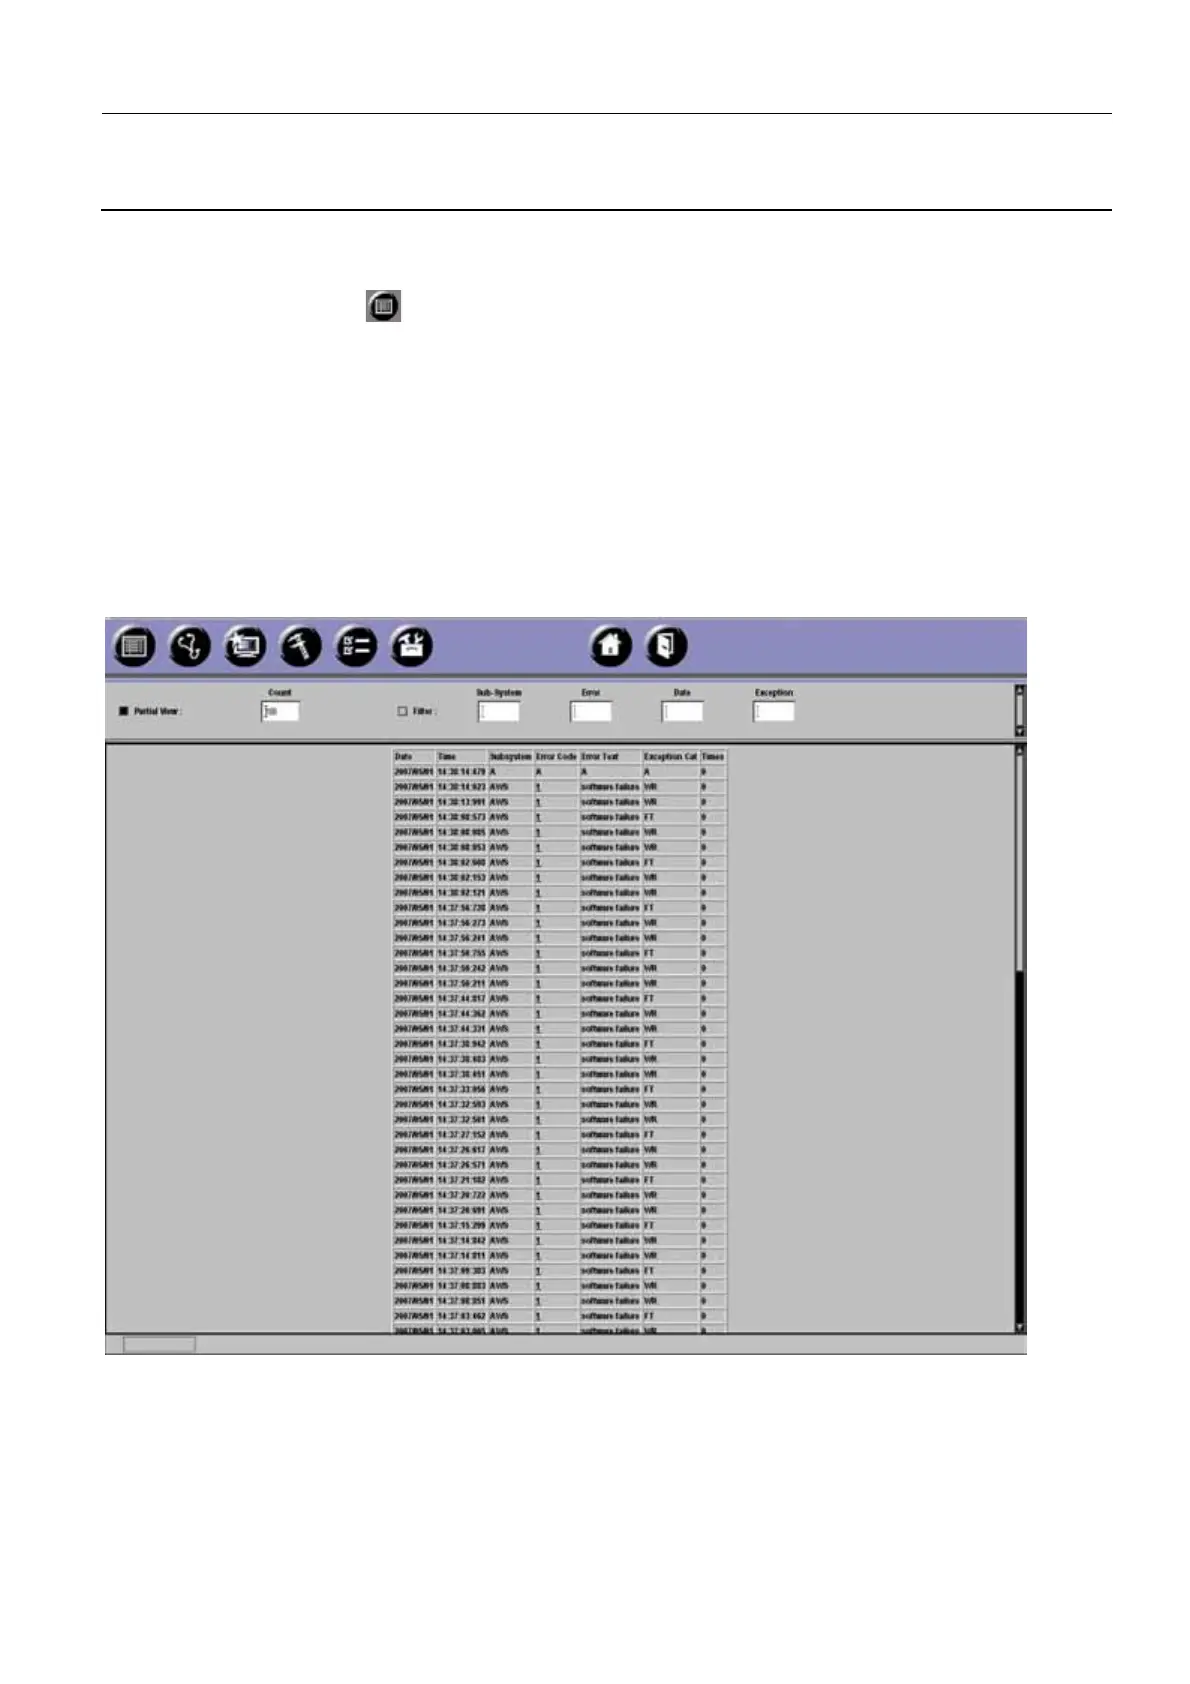
6. HOW TO USE THE ERROR LOG
Click the Error Log button in the Service Desktop navigation bar to view details of all errors logged
by the Senographe system.
To limit the number of errors displayed, type the desired number in the box, then click the Partial View
check box.
By default, errors are listed by date in descending order. To filter errors which satisfy a condition, type
the condition in the corresponding box, then click the Filter check box.
Click an error code for an explanation of the error. (not applicable for Gantry errors; see Note below).
Note:
Gantry errors are saved in a format which is slightly different from that of IDC and AWS errors.
Clicking on Gantry errors does not display an explanation.
ILLUSTRATION 12 - ERROR LOG ON V1/V2 CONTROL STATIONS
 Loading...