Art: 714374-00J Rev. Date: 25-Aug-11 12-7
Results Display
INTERPRETATION OF DISPLAYED RESULTS
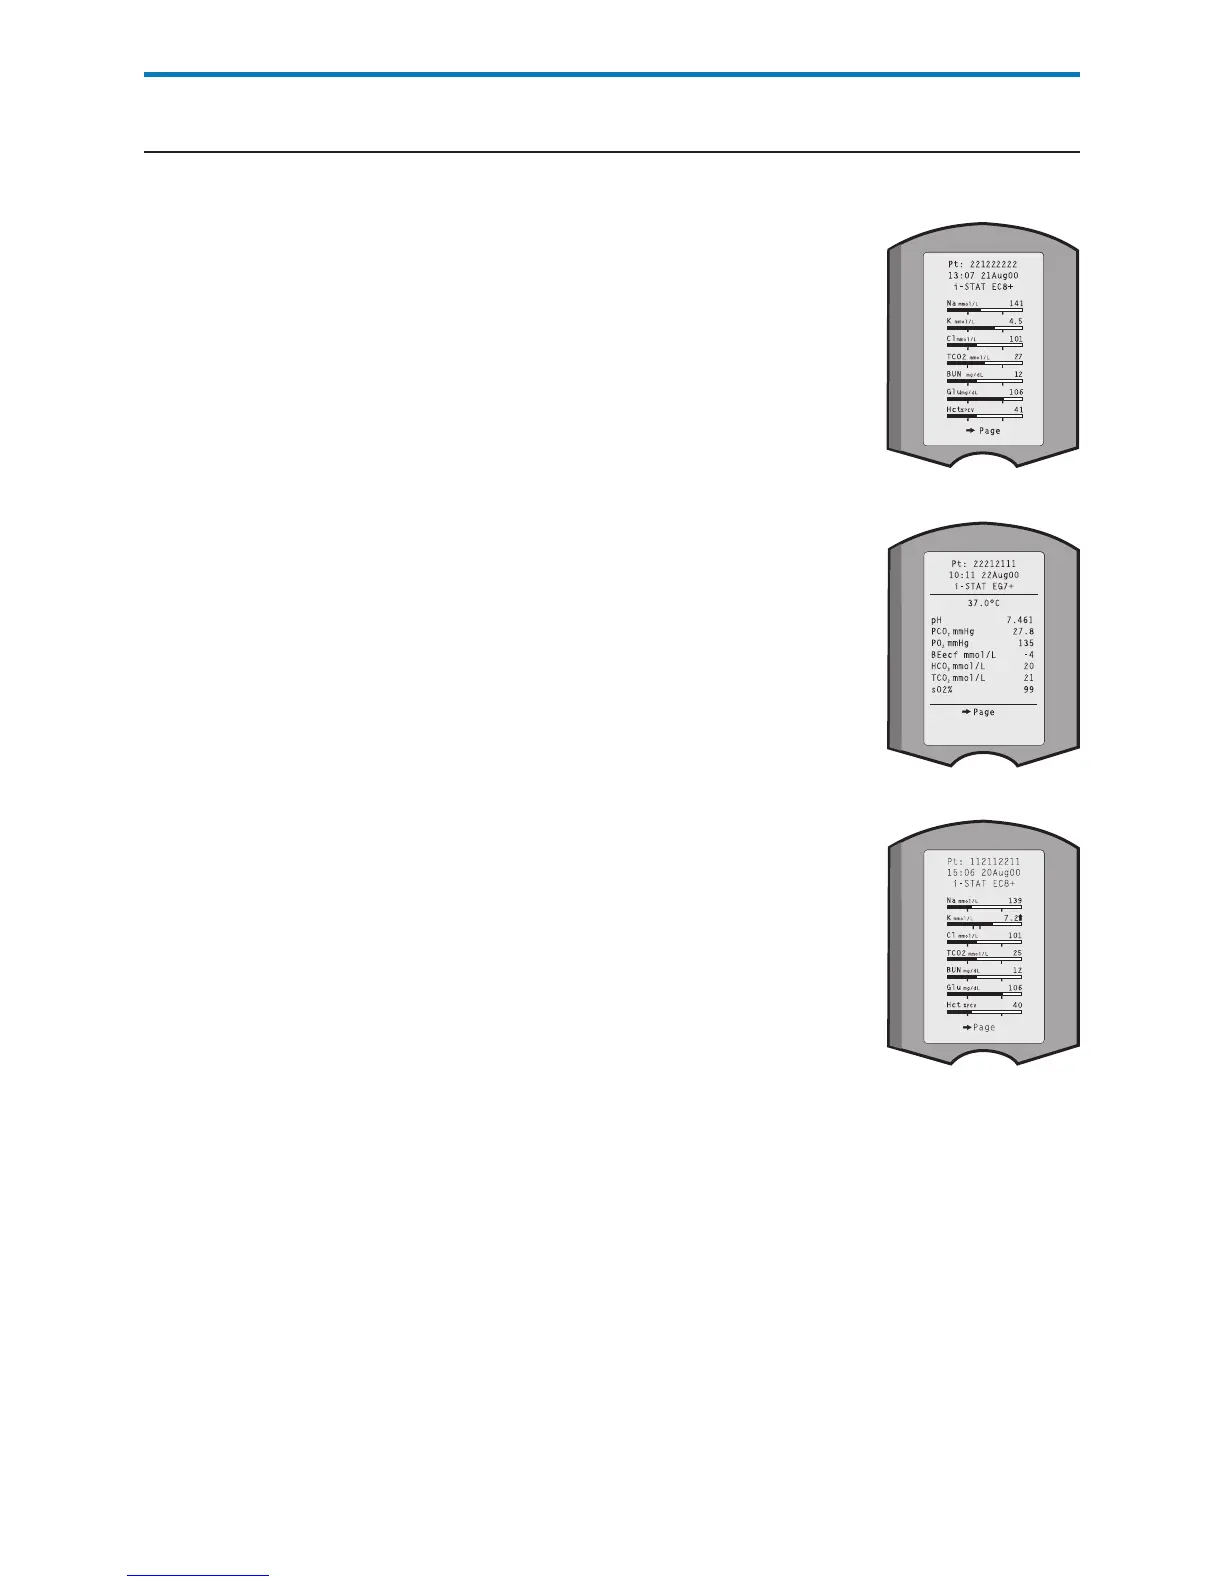
Test results are displayed with numerical concentration values in the units
selected for the Customization profile. For patient test
results, bar graphs depicting the values in relation to
referencerangesarealsodisplayed.Referencerangesare
marked on the bars by tic marks. When all test values
are within their reference ranges, the tic marks will
be centrally aligned. The bar graphs can be used as a
visual cue for distinguishing between “normal” and
“abnormal”results.Bloodgas,coagulation,andcTnI
results are not displayed with bar graphs and reference
ranges.
Ifa valueexceedsthereferencerange, thebargraph
may be rescaled to show the reference range and value
in relation to the measurement range.
Reportable Ranges
The reportable range (sometimes referred to as the
linear range) is the concentration range over which
test results are valid. Reportable ranges programmed
into the analyzer are listed in the Cartridge and Test
Informationsection.
Reference Ranges
Referenceranges(sometimesreferredtoasnormal
ranges) in the default Customization profile are
derived from the literature and are listed in the
CartridgeandTestInformationsectionaswellasin
the Customization option on the analyzer. Variables
such as sex, age, heritage and other demographic
factors of a population may cause a shift in these
ranges. Therefore, it is usually recommended
that each facility determine its own reference
ranges.Referencerangescanbechangedusingthe
CustomizationfunctionontheCentralDataStation.
Action Ranges
Actionranges(sometimesreferredtoascriticalvalues)
indicate results that require immediate attention. When
a test result falls outside the action range it is flagged as
either above the high action range or below the low
action range .Actionrangesareprogrammedinto
theanalyzerusingtheCustomizationfunctionontheCentralDataStationand
can be viewed on the analyzer under the Customization option.
Note: Sincethe and symbolscannotbeprintedfromtheMartelPrinter,
actionrangeagsonaMartelprinterwillappearwiththe<<>>symbol.
ACT Cartridges
WhentestingaCeliteACTorKaolinACTcartridge,anoptiontocancelthe
test will appear on the analyzer screen. The cancel test option will only appear
afterallthedataentryhasbeencompleted.Iftheoperatorchoosestocancel
thetest,theresultwilldisplayas"0".
 Loading...