Rev. Date: 23-May-12 Art: 716969-00J BNP - 9
Method comparison data were collected using CLSI guideline EP9-A2.
26
Venous blood samples were
collected in EDTA evacuated tubes and analyzed in duplicate on the i-STAT System. A portion of the
specimen was centrifuged and the separated plasma was analyzed in duplicate on the i-STAT System and
on the comparative method within 1 hour of collection. Deming regression analysis
27
was performed on the
first replicate of each sample. In the method comparison table, n is the number of specimens in the first
data set, Sxx and Syy refer to estimates of imprecision based on the duplicates of the comparative and the
i-STAT methods respectively. Sy.x is the standard error of the estimate, and r is the correlation coefficient.*
Method comparisons may vary from site to site due to differences in sample handling, comparative method
calibration and other site specific variables.
The i-STAT BNP assay is designed for quantitation of BNP in whole blood or plasma samples. A series
of samples for comparison of whole blood and plasma results was prepared from blood drawn from
twenty-five nominally healthy donors. For each donor, whole blood (unspiked) and plasma obtained via
centrifugation were first run simultaneously in duplicate i-STAT BNP test cartridges. A whole blood sample
was then spiked with BNP and, following a short equilibration period, a plasma sample was prepared by
centrifugation and the whole blood and plasma samples were run simultaneously in duplicate. Three lots
of i-STAT BNP test cartridges were employed with a single lot being used for each donor. The results of
Deming regression of whole blood vs plasma (x-axis) correlation data are summarized below for all samples
( [BNP] < 5000 pg/mL) and separately for samples with [BNP] < 1000 pg/mL.
*The usual warning relating to the use of regression analysis is summarized here as a reminder. For any analyte, “if the data is a narrow range, the
estimate of the regression parameters are relatively imprecise and may be biased. Therefore, predictions made from estimates may be invalid”.
26
The
correlation coefficient, r, can be used as a guide to assess the adequacy of the comparative method range in overcoming the problem. As a guide, the
range of data can be considered adequate if r>0.975.
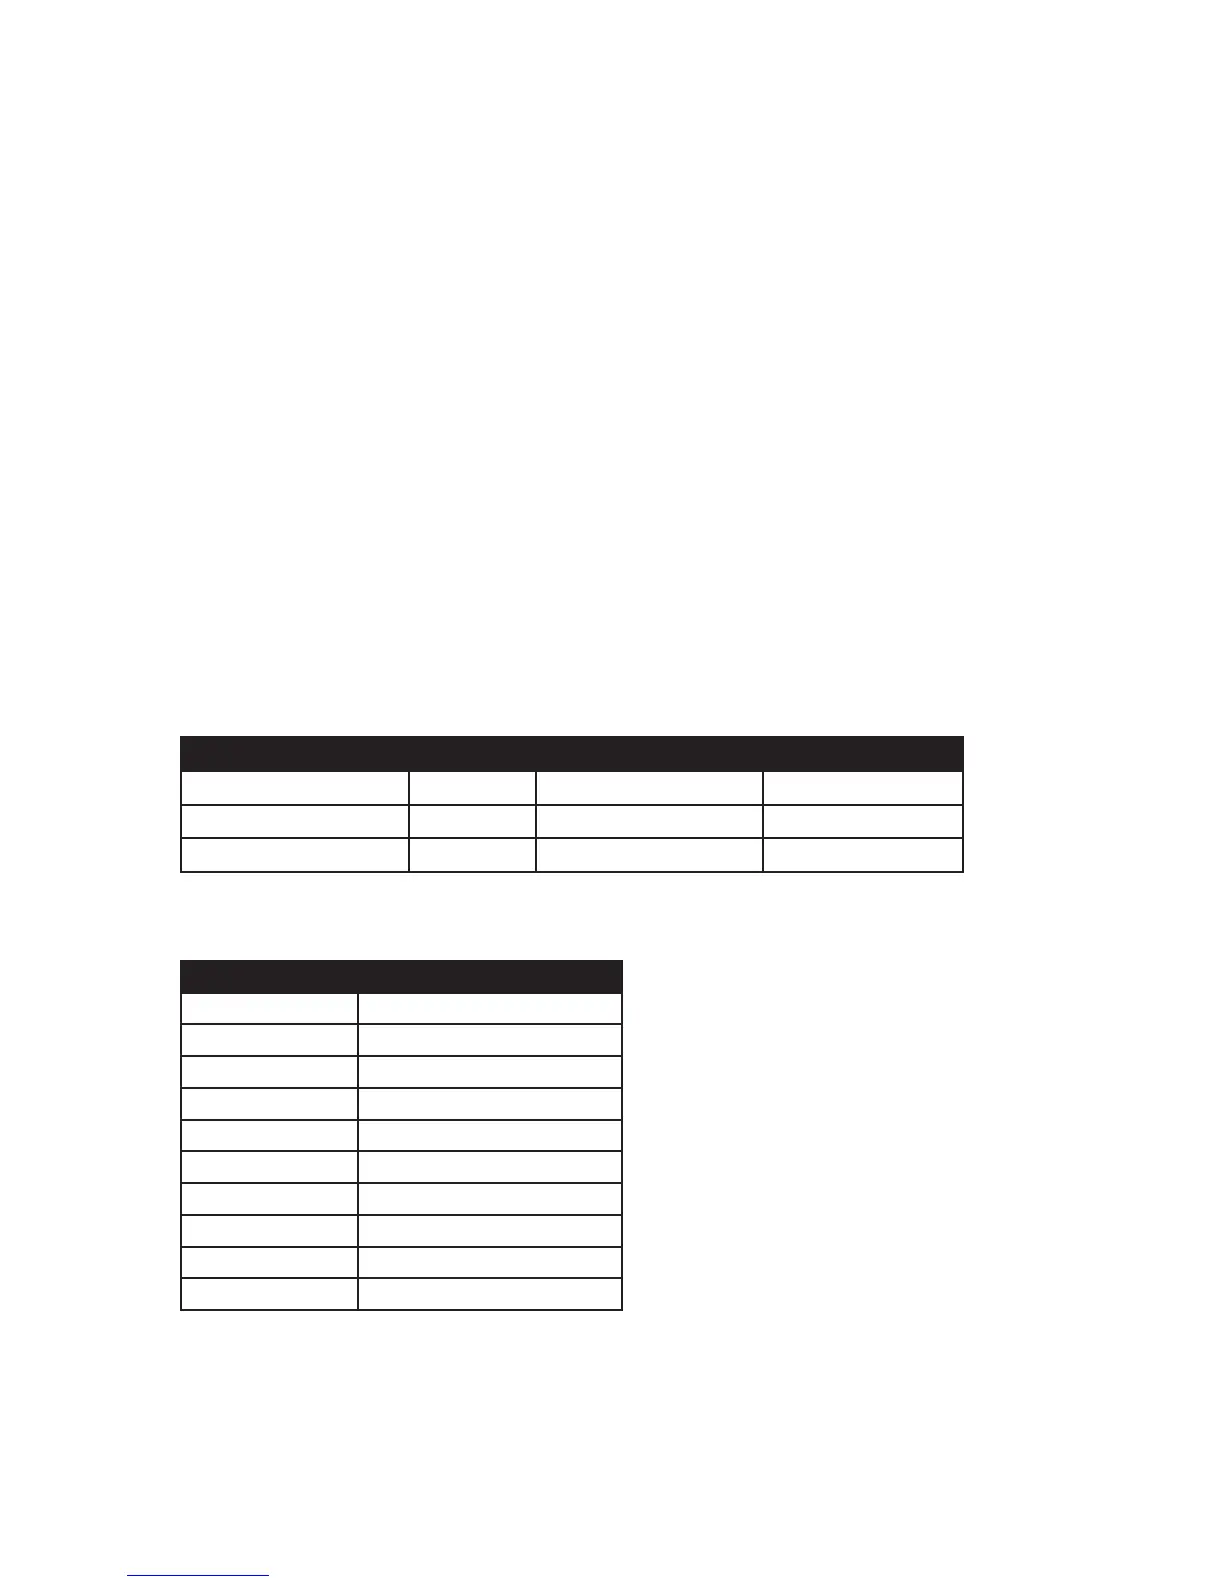
Precision Data (pg/mL)
Aqueous Control Mean %CV (within-run) %CV (total)
Level 1 126 9.0 11.1
Level 2 1551 6.6 8.1
Level 3 3337 8.0 9.8
Method Comparison
Abbott ARCHITECT
N 433
Mean (pg/mL) 482.1
Sxx (pg/mL) 38.1
Syy (pg/mL) 97.6
Slope 0.971
Intercept -14.4
Sy.x 198.0
Xmin 5
Xmax 4797.7
Correlation, r 0.972
 Loading...