6-20 CASE Revision C
2060290-201
During the Test
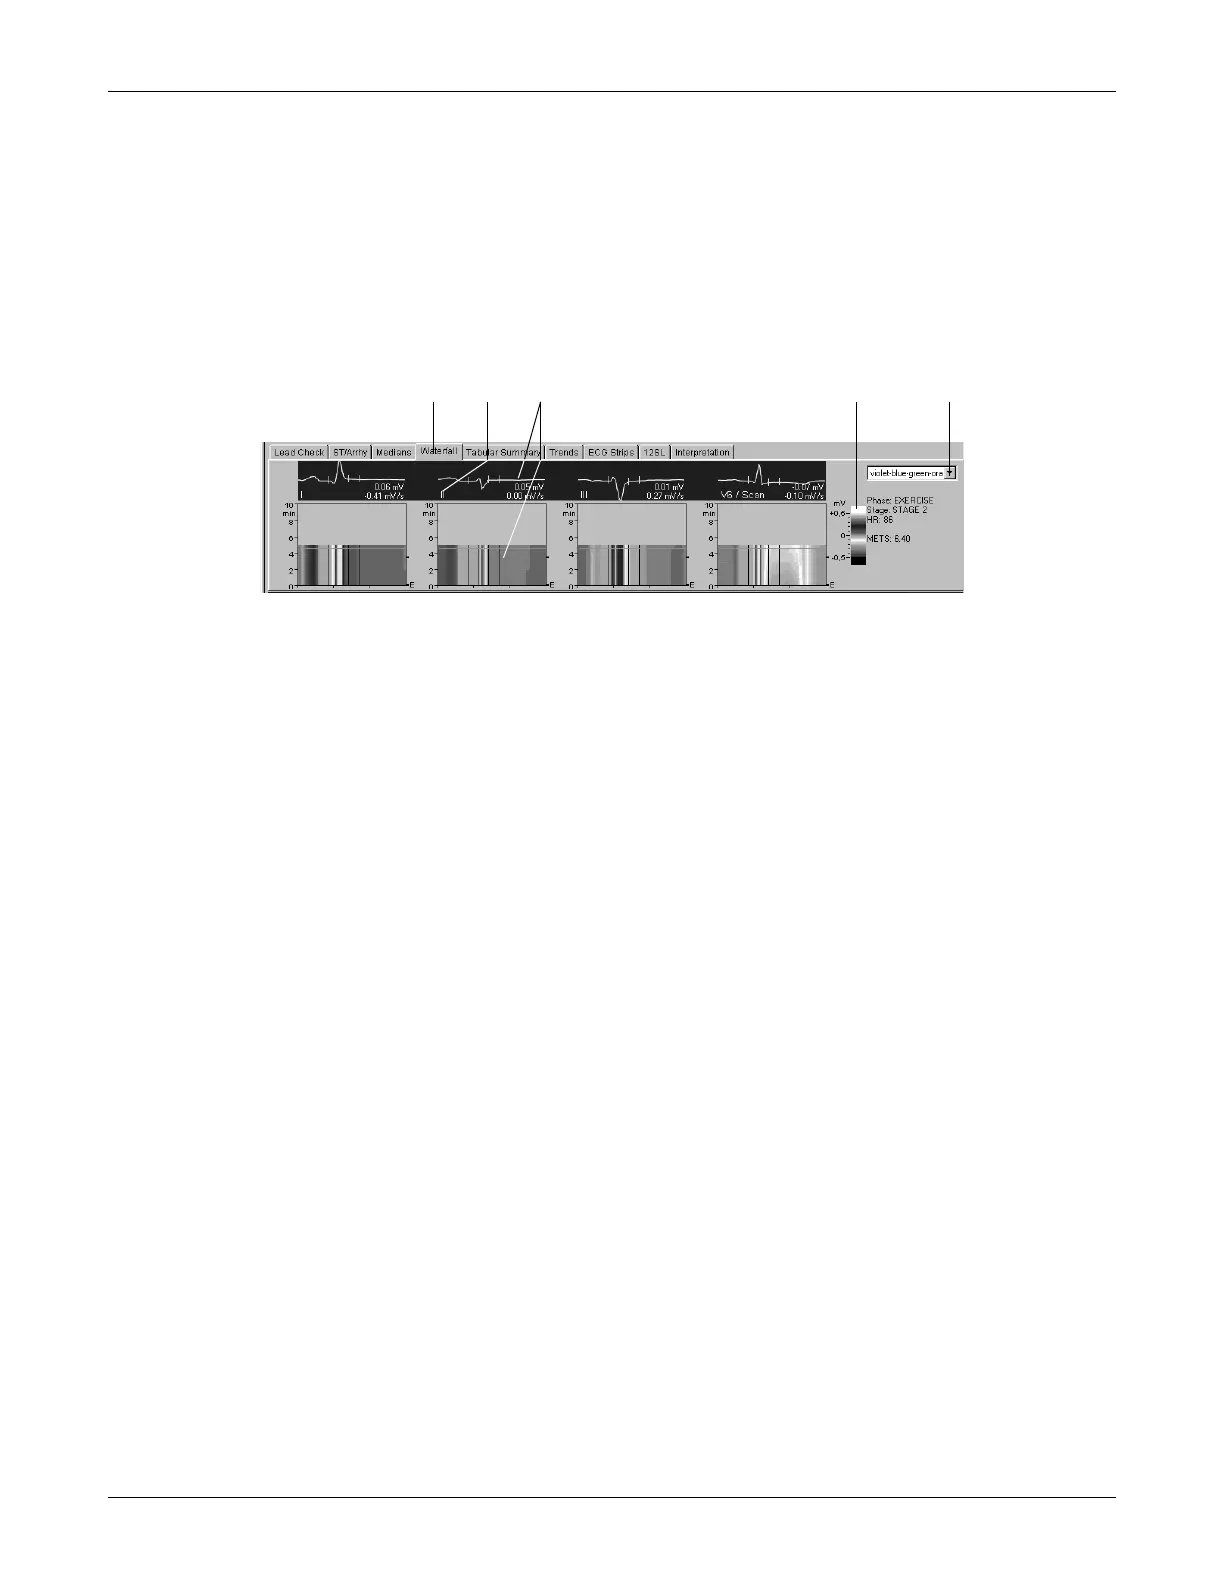
Waterfall Window
This window displays a graphic color representation of the median beat
changes in the course of the test (updated at 30 second intervals).
Click anywhere in the waterfall to display the median complex and
measurement of the corresponding point in time (associated phase, stage,
HR, BP, and METS appear at the right).
A Click the tab to display the Waterfall window.
B Click the lead label to change the displayed leads.
C Median complex, ST measurement and corresponding waterfall.
D Color code of the different amplitudes in mV.
E Click to select the color menu.
 Loading...