Revision C CASE 7-13
2060290-201
Post Test Review
Graphics
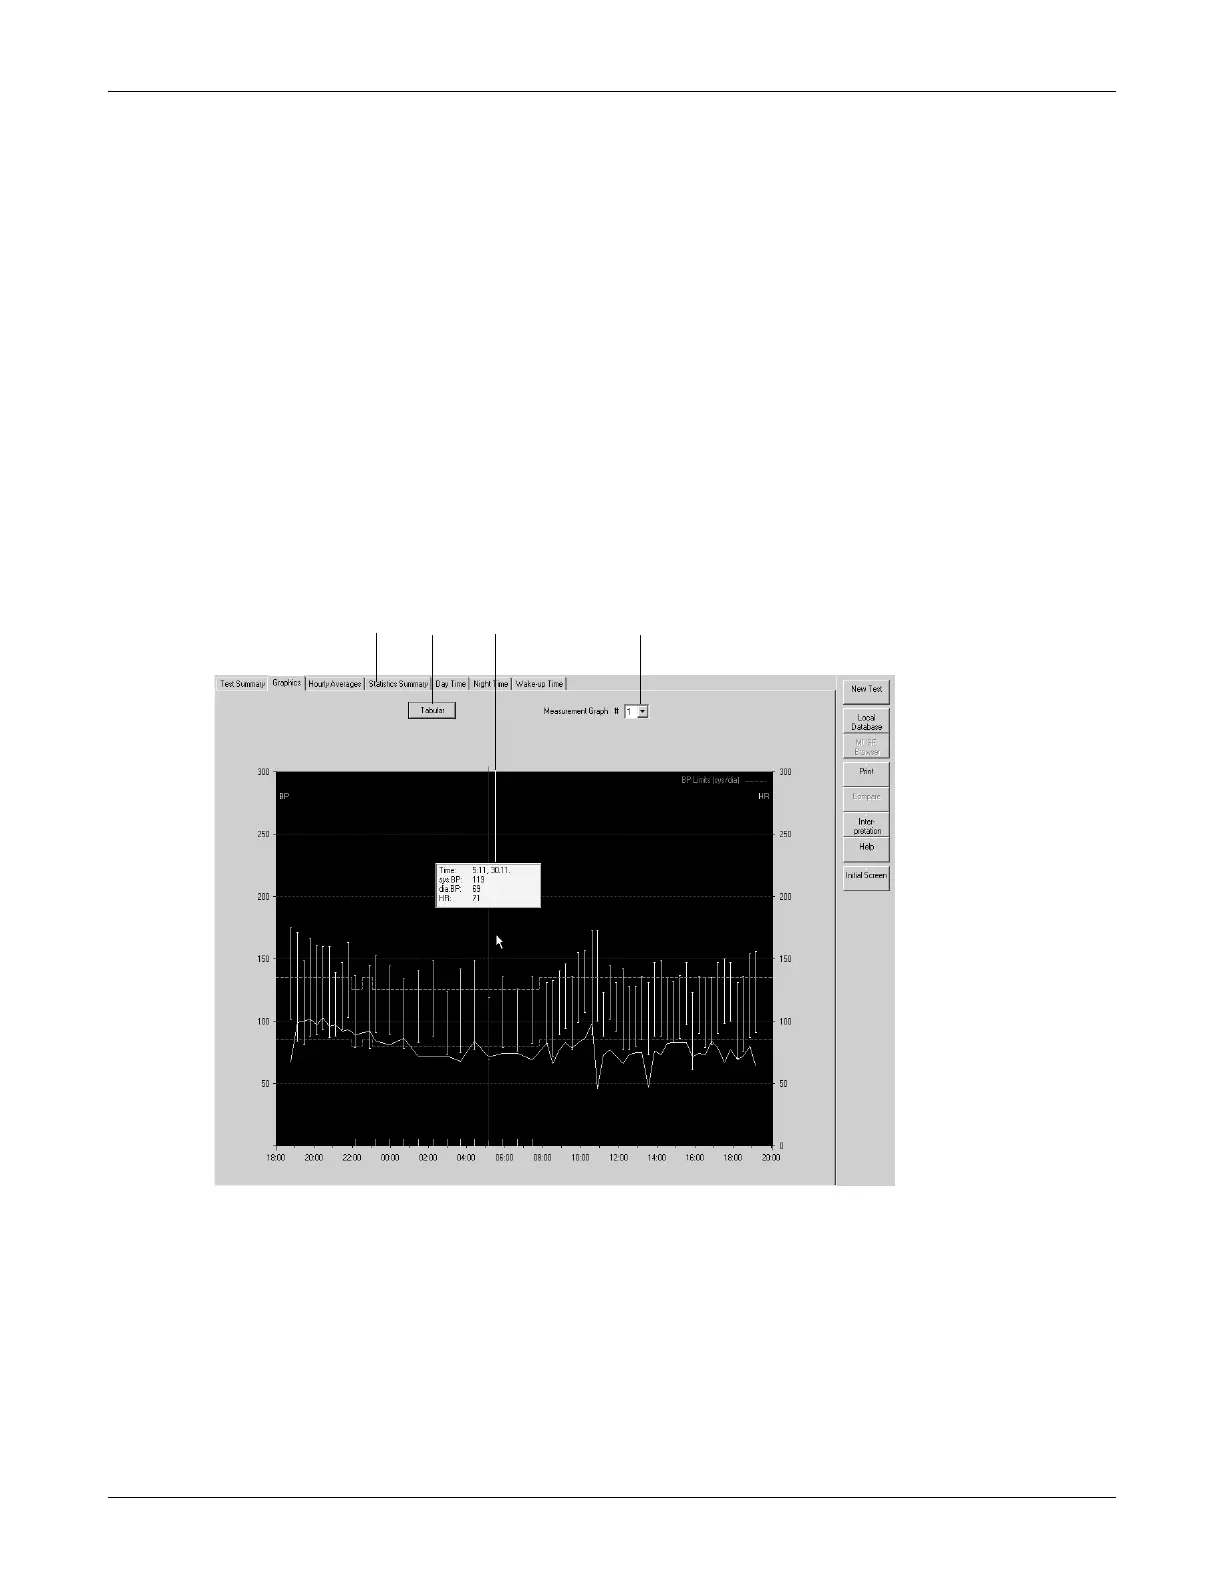
The Graphics screen shows all BP values acquired over the monitoring
period. The blood pressure values are shown at the top, the pulse
pressure values (systolic pressure minus diastolic pressure) below. You
can show or hide the pulse pressure values (see “Ambulatory Blood
Pressure Measurement Setup” on page 12-31).
You can choose between display formats 1, 2 and 3. This format can be
preset in the System Settings and is saved as a user-specific
configuration. The selected format will also be used for printouts.
A small window with the values corresponding to the measurement will
be displayed as you move the mouse over the diagram.
For measurements taken with TONOPORT IVa, the ECG strips are also
displayed.
A Click a tab to display the corresponding window.
B Click button to display the tabular summary.
C Window with measuring values at the cursor position.
D Click down arrow to select the display format (the same format is used for the
printout).
 Loading...