Revision C CASE 6-35
2060290-201
After the Test — Post Test Review
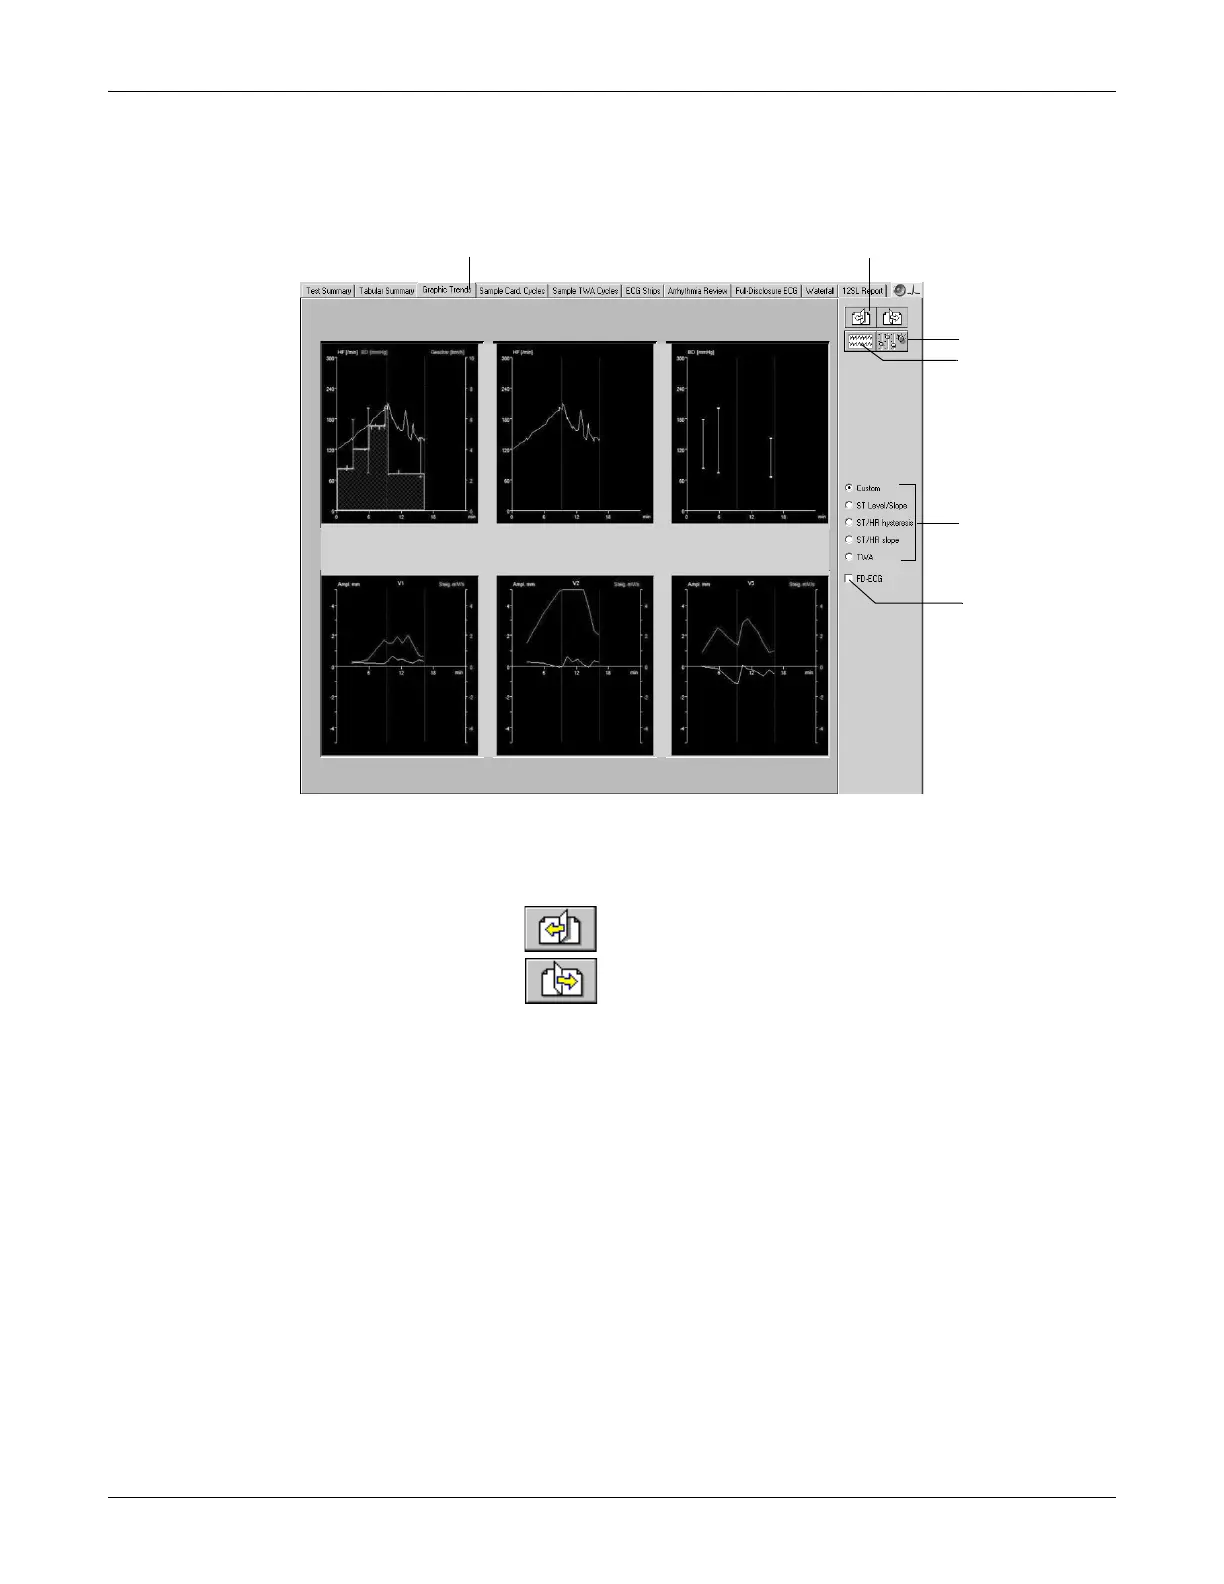
Graphic Trends
Overview
Note
The system starts collecting trend data at the beginning of the
exercise phase.
A Click to display the graphic trends.
B Click to display other leads of the trends (not available on all screens).
backward
forward
C Click icon to display the trend configuration window.
D Click to jump to a separate full disclosure ECG window.
E Click an option button to display other trend formats.
Click Custom to display user configured trends.
Click ST Level/Slope to display the trend of ST level and slope versus time.
Click ST/HR Loops to display the 2-dimensional representation of ST level versus
HR. To expand the ST and HR axes, click Auto Scale ST and Auto Scale HR (see
section “Configuring Trends” on page 12-15).
If you purchased the STHY option (ST/HT Hysteresis), ST/HR Hysteresis will be
displayed here instead of ST/HR Loop.
Click ST/HR Slope to display the heart rate-adjusted slope for all leads.
Click TWA to display the TWA trends.
F Click to display the full disclosure ECG (see next page).
 Loading...