5-20 CASE Revision C
2060290-201
Post Test Review
Arrhythmia Review
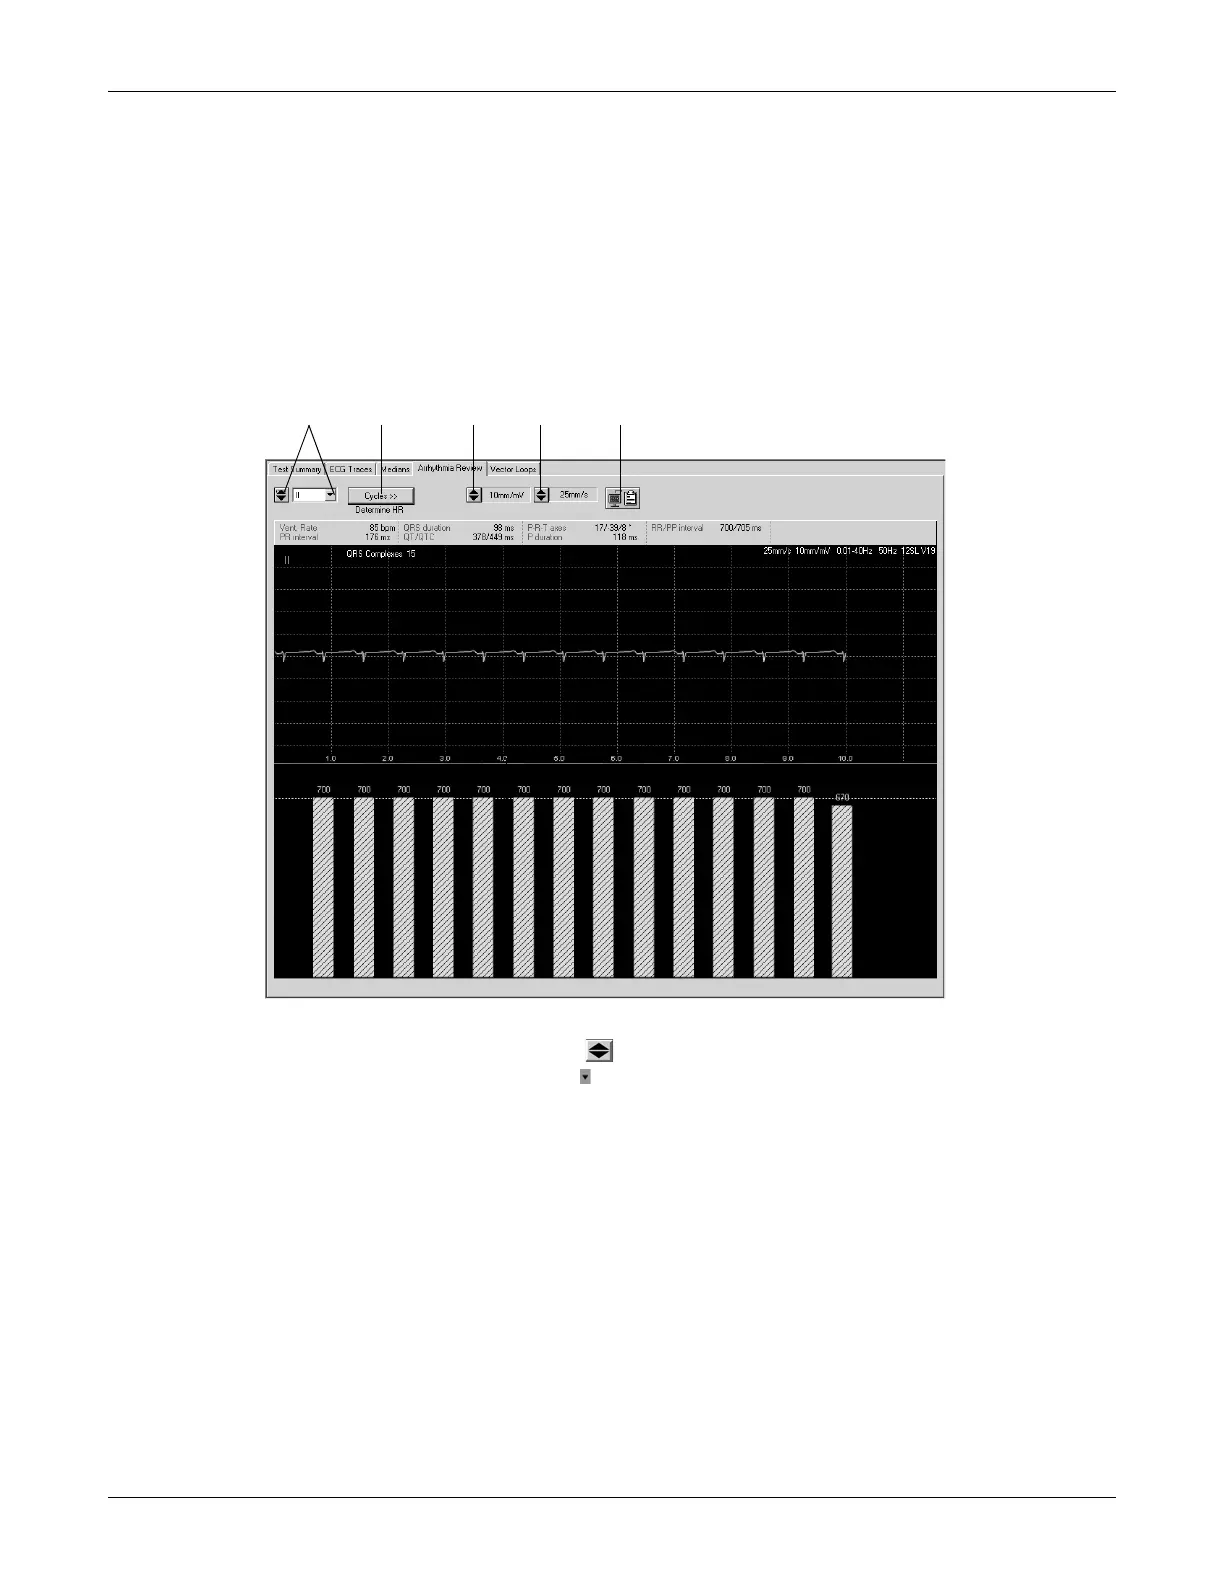
This screen shows one lead of the reference ECG at a time. A bar
diagram below the signal trace indicates, for each individual QRS
complex, the deviation of the RR interval from the mean RR interval.
Furthermore, you can determine the HR over a selectable ECG segment.
A Click to select the lead:
With you scroll through the leads,
with you open the list.
B Click to determine the number of cardiac cycles (only for atrial fibrillation or
flutter).
C Click to select the gain (amplitude).
D Click to select the speed.
E Click icon to copy the waveform area to the Clipboard.
 Loading...