6-52 CASE Revision C
2060290-201
After the Test — Post Test Review
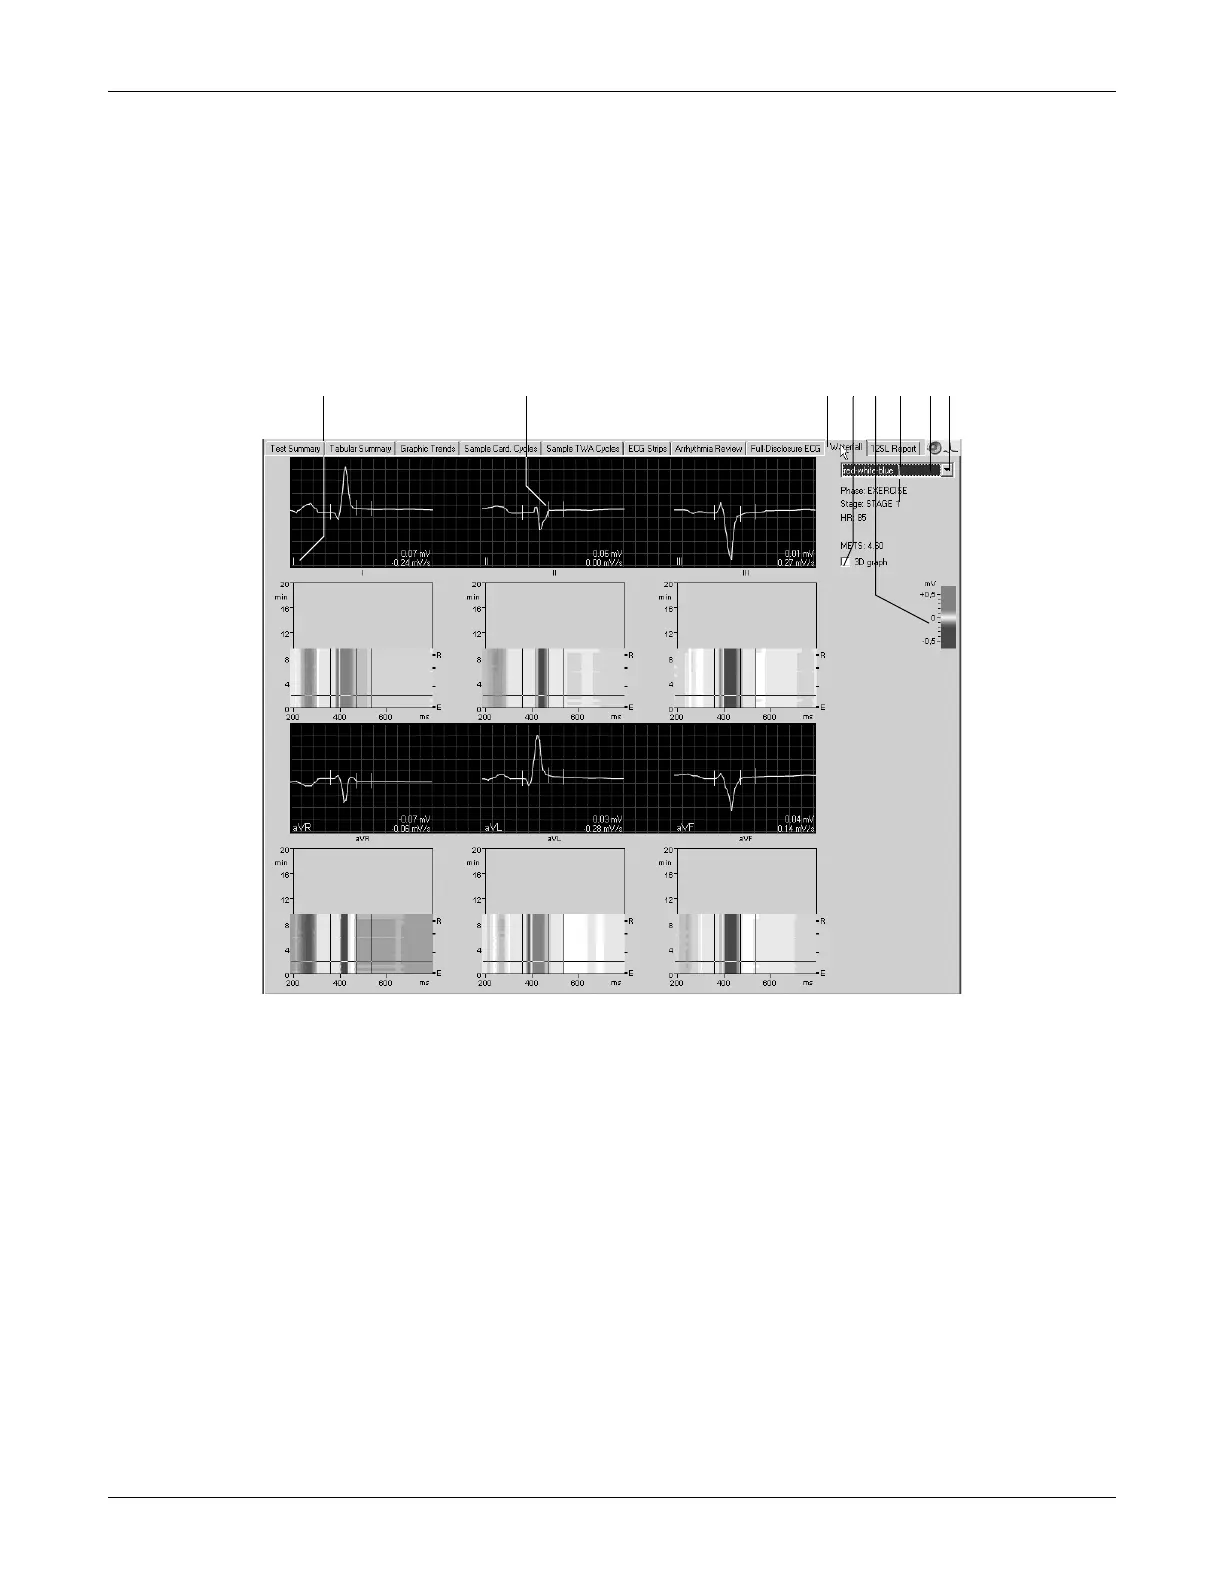
Waterfall
The Waterfall display is a graphic color representation of the median
beat changes in the course of the test (updated at 30 second intervals).
Click anywhere in the waterfall to display the median complex and
measurement of the corresponding point in time (associated phase, stage,
HR, BP, and METS appear at the right).
A Click the lead label to change the displayed leads.
B Median complex selected in the waterfall.
C Click to display the Waterfall.
D Select check box to view the 3D graph (see next page).
E Color code of the different amplitudes in mV.
F Details of the selected median complex.
G Click to play the audio ECG (see “Audio ECG” on page 6-51).
H Click to select the color menu.
 Loading...