Monitoring Status and Statistics
D-Link Unified Wired and Wireless Access System
Oct. 2015 Page 479
D-Link UWS User Manual
Managed Access Point Statistics
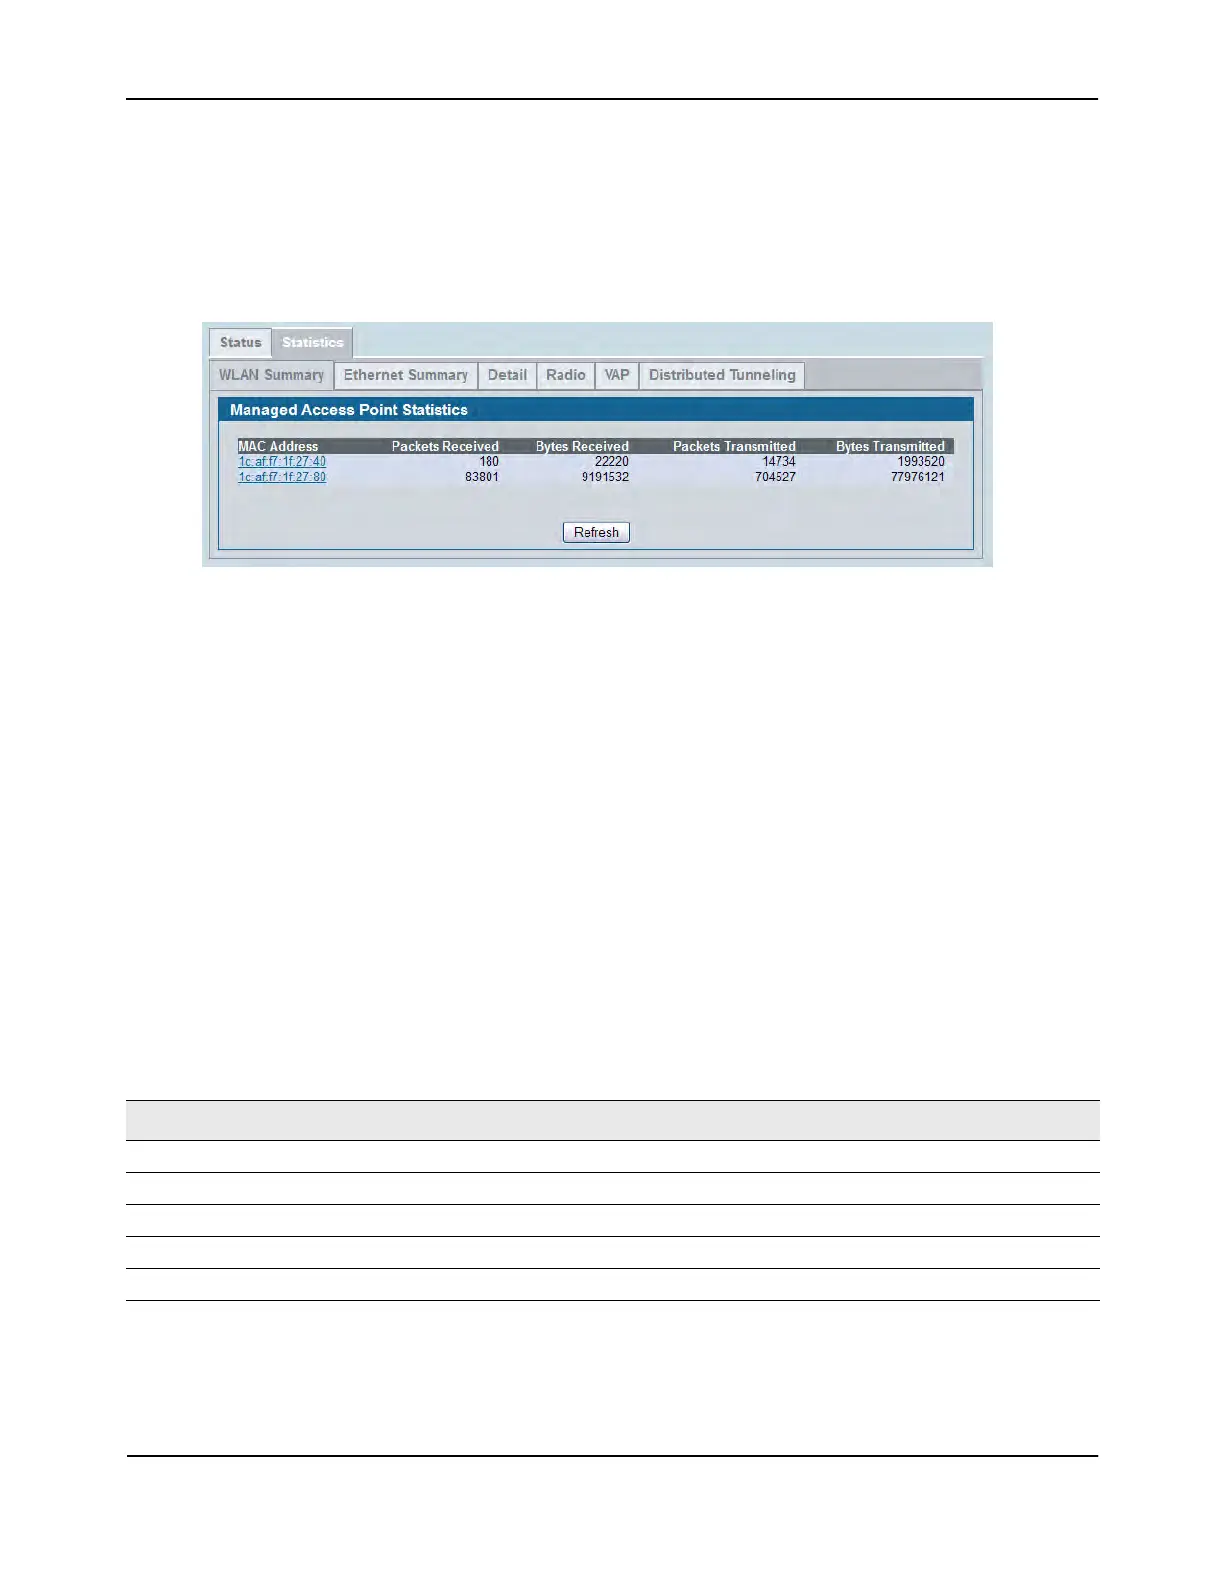
The managed AP statistics page shows information about traffic on the wired and wireless interfaces of the
access point. This information can help diagnose network issues, such as throughput problems.
The following figure shows the Managed Access Point Statistics page with a managed AP.
Figure 315: Managed AP Statistics
The following tabs are available from the Managed AP Statistics page:
• WLAN Summary: Shows summary information about the wireless interfaces on each AP the switch
manages.
• Ethernet Summary: Shows summary information about the Ethernet (wired) interfaces on each AP the
switch manages.
• Detail: Shows the number and type of packets transmitted and received on a specific AP.
• Radio: Shows per-radio information about the number and type of packets transmitted and received for a
specific AP.
• VAP: Shows per-VAP information about the number of packets transmitted and received and the number
of wireless client failures for a specific AP.
• Distributed Tunneling: Shows information about the L2 tunnels currently in use on the AP.
On the WLAN Summary and Ethernet Summary pages, click the MAC address of the AP to view detailed
statistics about the AP.
Table 279: Managed Access Point WLAN Summary Statistics
Field Description
MAC Address The Ethernet address of the DWS-4000 Series switch-managed AP.
Packets Received Total packets received by the AP on the wireless network.
Bytes Received Total bytes received by the AP on the wireless network.
Packets Transmitted Total packets transmitted by the AP on the wireless network.
Bytes Transmitted Total bytes transmitted by the AP on the wireless network.
 Loading...