Visualizing the Wireless Network
D-Link Unified Wired and Wireless Access System
Oct. 2015 Page 669
D-Link UWS User Manual
Setting Up the Graph
To start the WLAN Visualization tool, click WLAN Visualization > Launch... This opens a new browser window
and starts the Java applet.
The first time you launch the WLAN Visualization tool, there is no background image, and all discovered WLAN
components are ungraphed. The screen is split into two panes. The left pane has four container views that are
used to hold un-graphed components. The right pane is an area where graph definitions are shown. This graph
pane is initially blank and must be defined before WLAN components can be placed.
Creating a New Graph
You can create a graph for each floor of each building within the wireless system. Graphs can be created and
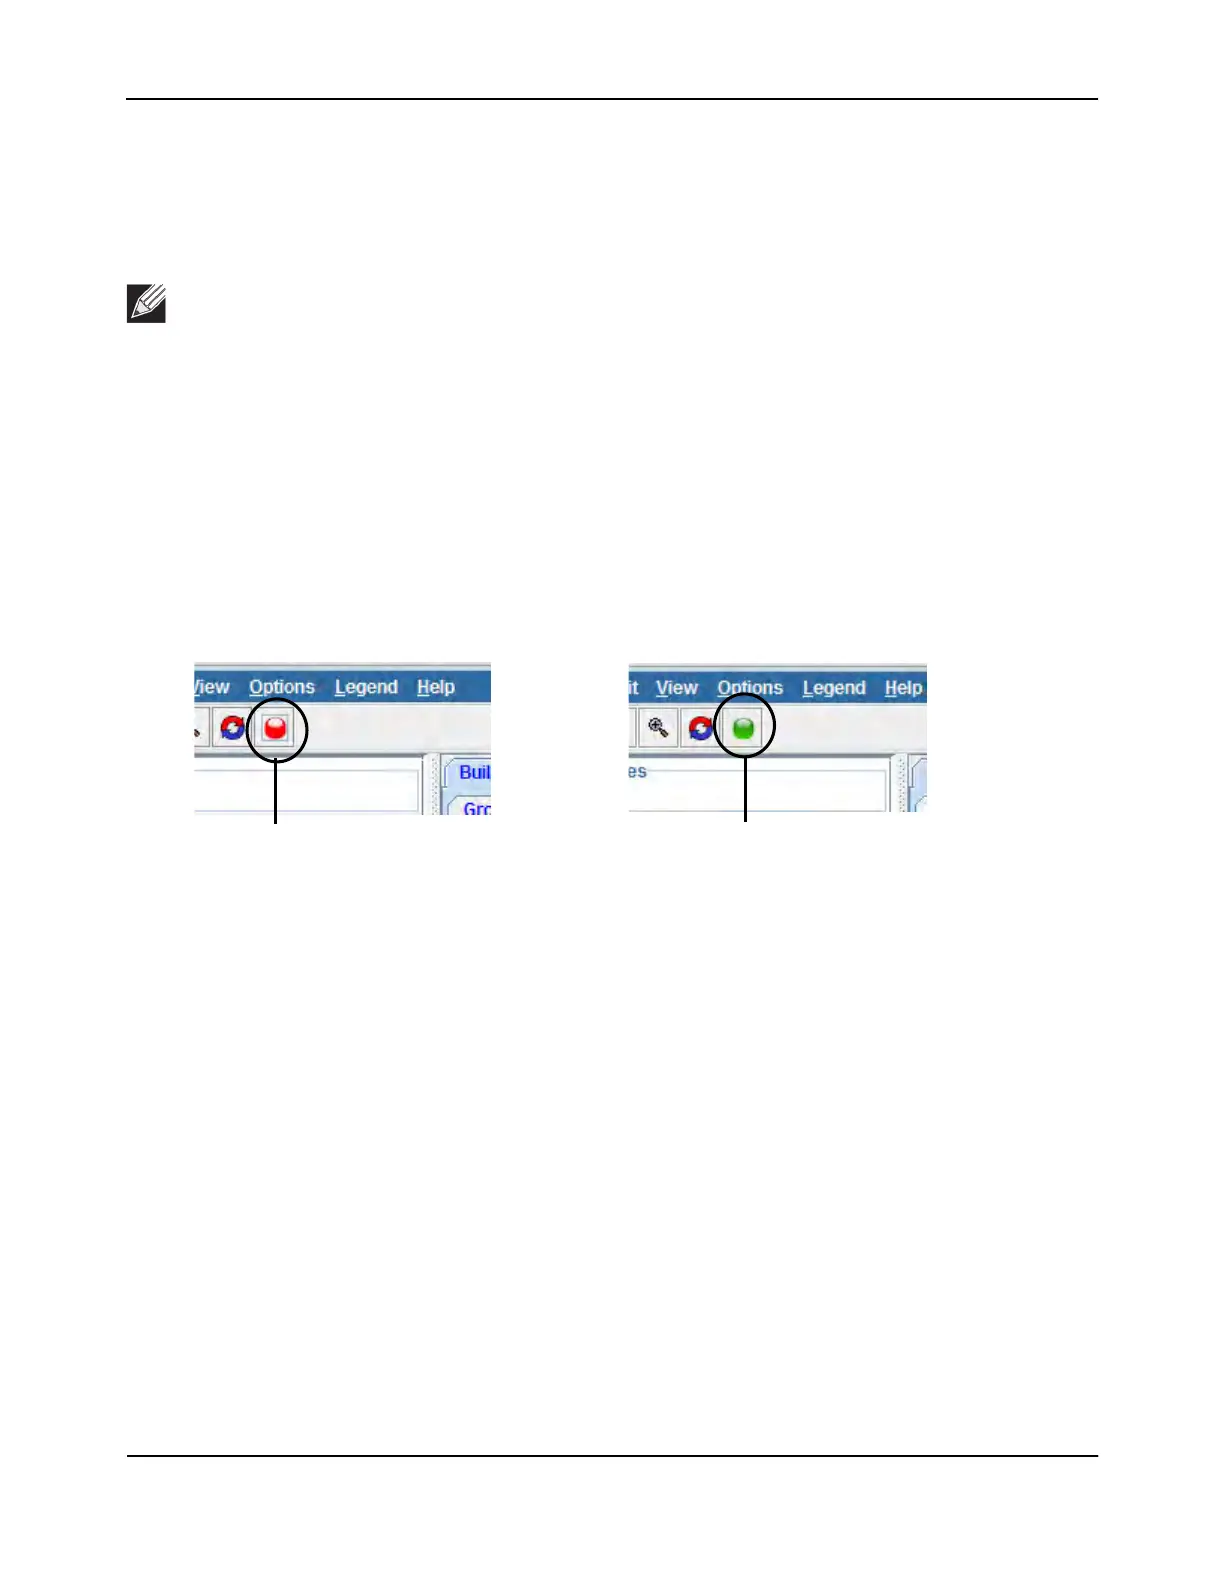
edited only when Live Visualization is disabled. To disable Live Visualization, click the Live Visualization control
button so that it flashes red.
Figure 421: Live Visualization Control
To create a new graph and load the background image, launch the WLAN Visualization tool and use the
following steps.
1. Ensure that Live Visualization is disabled (red).
2. From the WLAN Visualization menu bar, click Edit > New Graph.
The New Graph Definition dialogue box opens.
3. Enter a name to identify the building and floor, and select the appropriate numbers for the building and
floor.
4. Select the image to use as the background.
For information about how to upload an image to use as a graph background, see “Importing and
Configuring a Background Image” on page 668
Note: Your browser must allow pop-up windows to open from the switch.
Live Visualization Disabled Live Visualization Enabled
 Loading...