www.trilithic.com
Page IV-149
180 DSP Operation Manual
Signal Level Meter
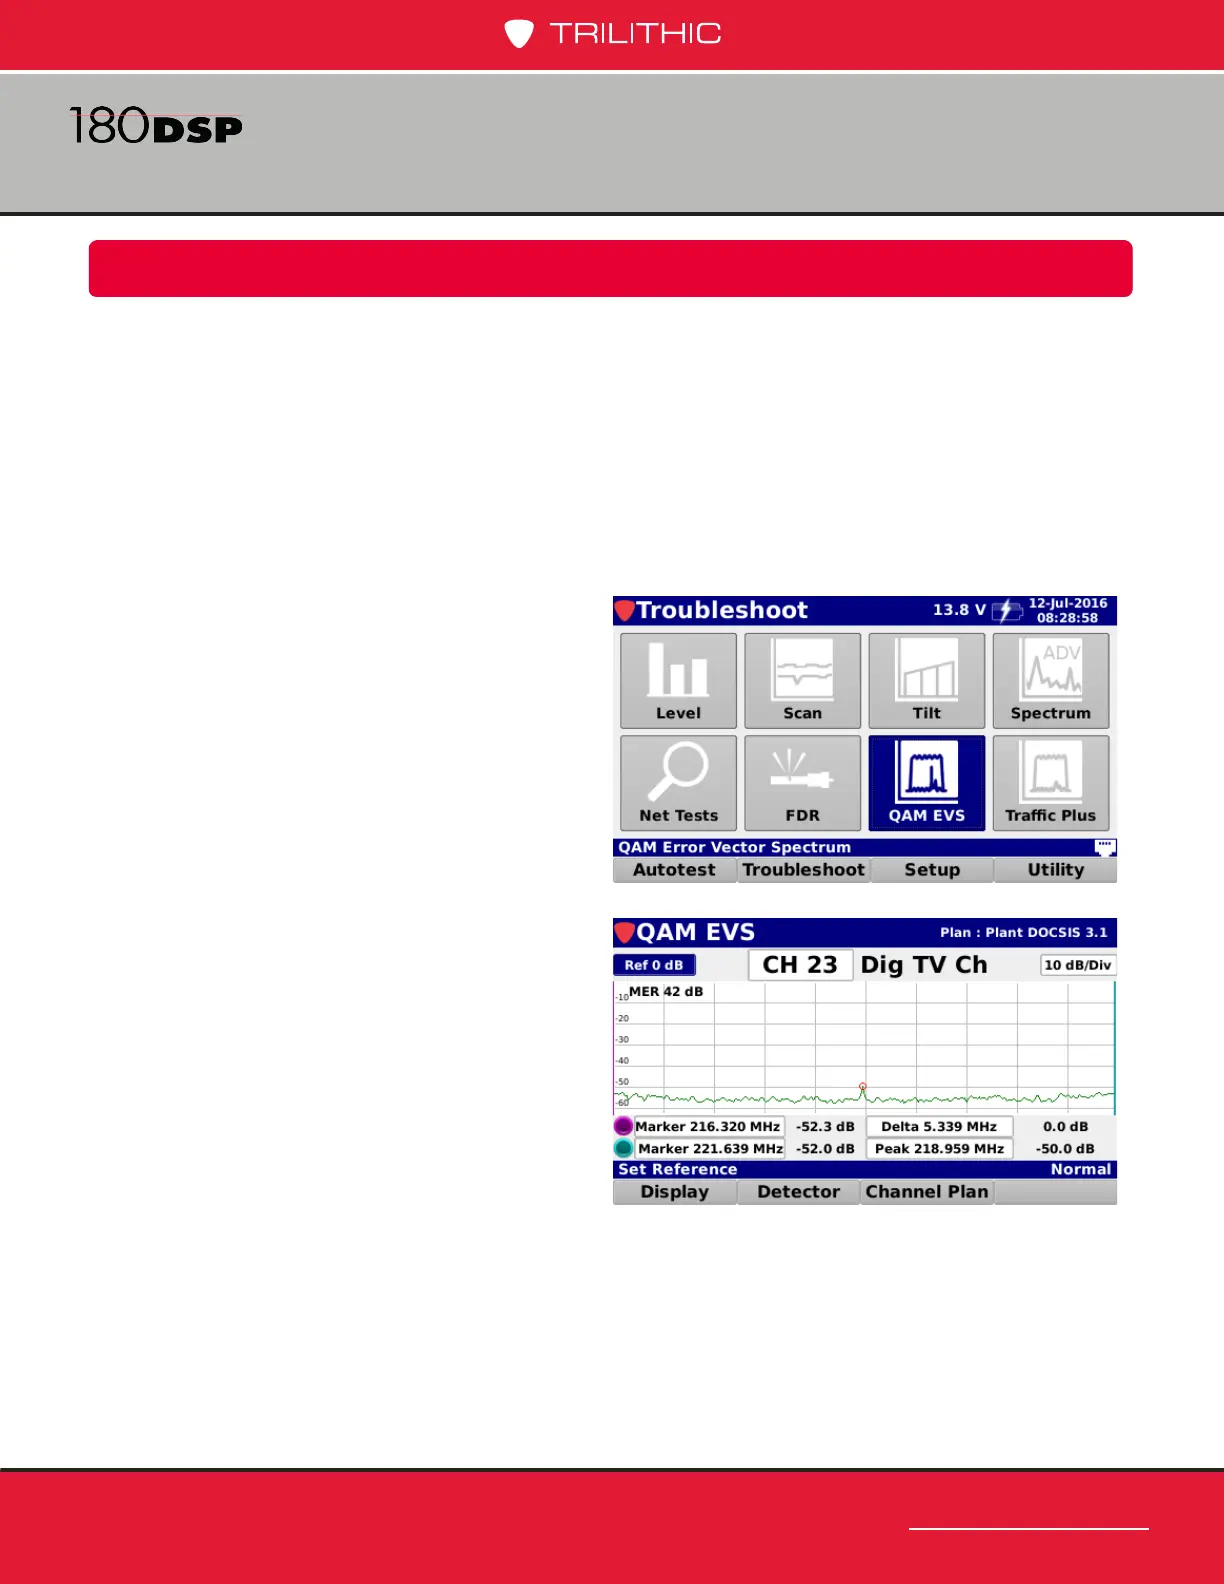
The QAM EVS screen will be displayed as
shown in the image to the right.
The QAM EVS test can be performed on a
channel from a specied channel plan or
custom user entered QAM channel. The
mode of operation is a cross between the
QAM Mode and the Spectrum Analyzer
mode.
As soon as you enter the QAM EVS Mode, it
is tuned to the last tuned channel in the Level
Mode. You can then adjust the reference (top line of spectrum display), the digital channel, the
modulation, the frequency, the symbol rate, the bandwidth, and the dB per division. The center
frequency of the display is the center frequency of the channel. The span of the display is the
channel’s symbol rate.
When the unit locks onto the QAM signal, the error vector spectrum is plotted. The current
MER is shown in the upper left of the graph. The markers and peak can be used to help
determine the frequency of unwanted signals present in the QAM channel.
QAM Error Vector Spectrum Analysis
(OPTIONAL)
Chapter 8
Overview
QAM Error Vector Spectrum Analysis (EVS) is an optional feature of the 180 DSP. If you do not
have this option, call Trilithic at (800) 344-2412 in order to purchase an option activation code
and start using this option today.
To view the installed functions on your instrument, see Section II: Setup Menu, Chapter 2:
Instrument Information.
When activated in a 180 DSP, the QAM Error Vector Spectrum Analysis feature provides users
with the ability to tune the meter to a downstream QAM channel and display its error vector
spectrum to reveal noise and ingress that may be present under the QAM channel.
Select the QAM EVS icon as shown in the
image to the right to perform a QAM Error
Vector Spectrum Analysis.

 Loading...