www.trilithic.com
Page IV-153
180 DSP Operation Manual
Signal Level Meter
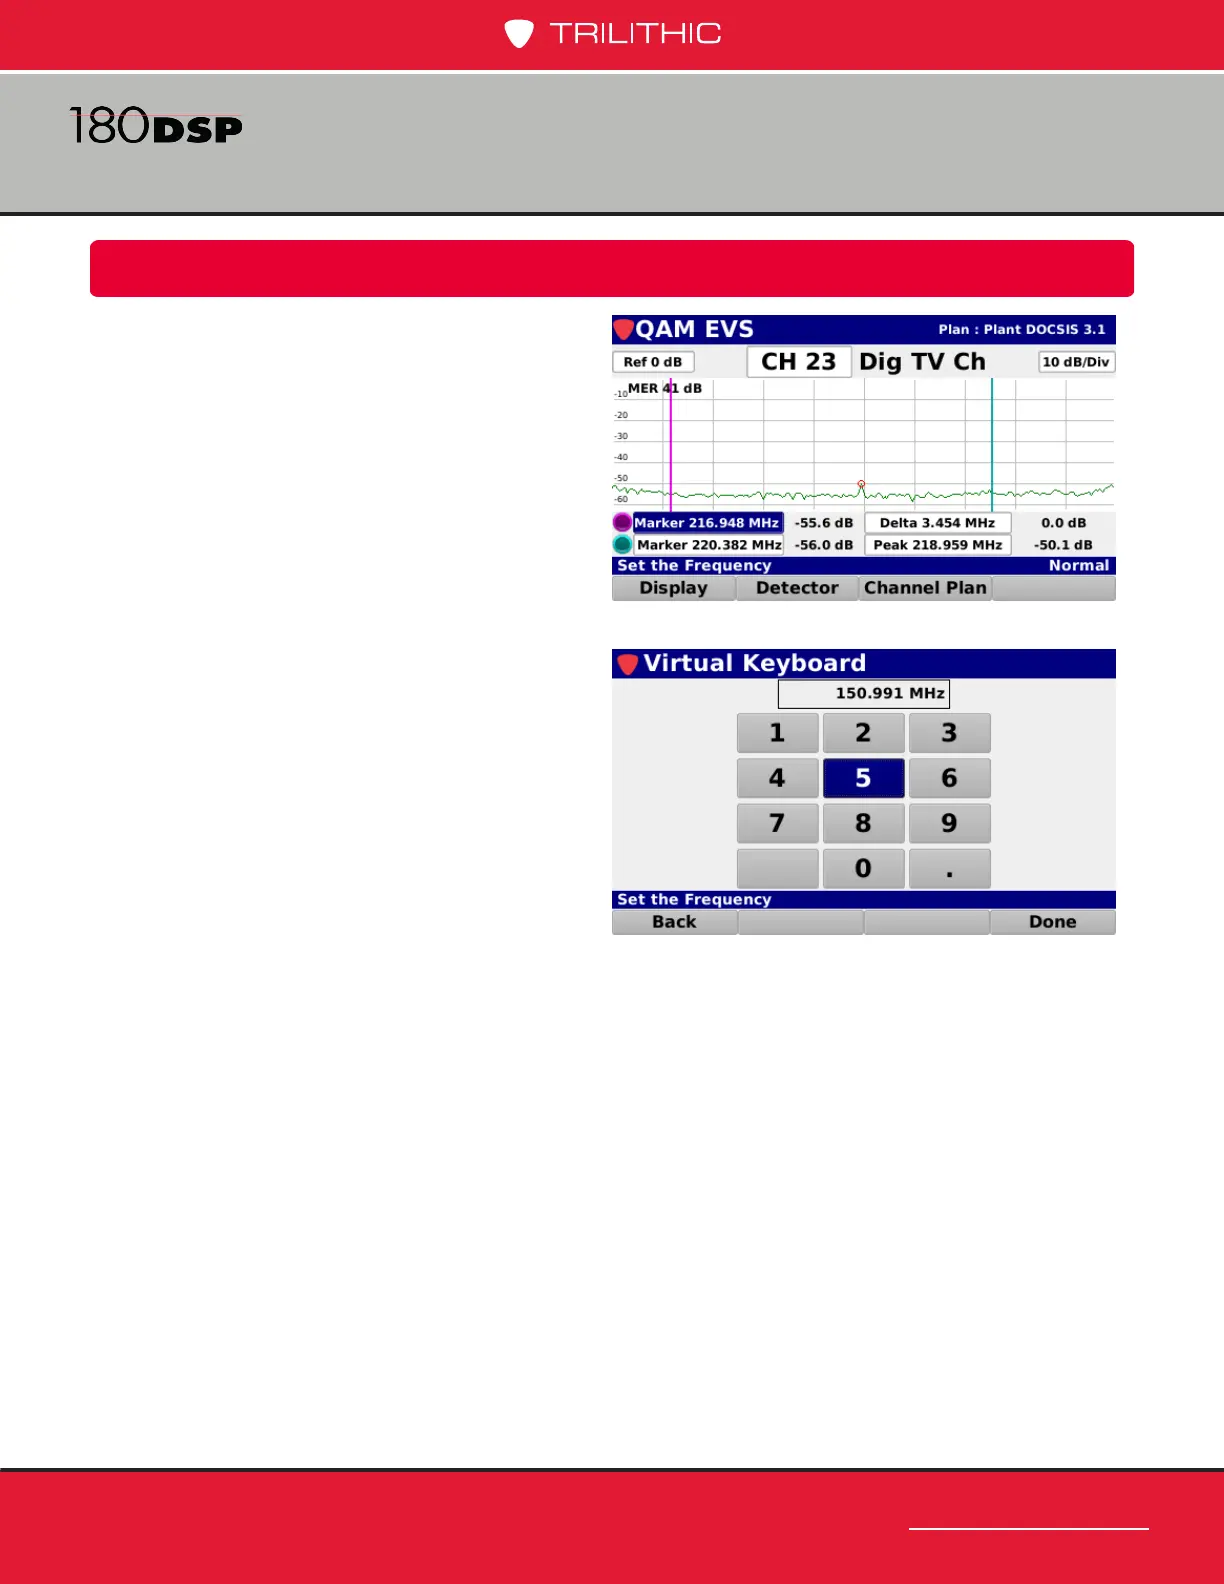
The QAM Error Vector Spectrum Analysis
measurement includes two on-screen
markers that are used for measurement of
specic frequencies within the QAM error
vector spectrum.
The markers are represented by the
following color bullets and vertical lines:
• Marker 1 – Purple
• Marker 2 – Light Blue
Highlight the desired marker and use either
of the following methods to change the
marker location:
• Use the up/down arrow buttons to
change the marker in 0.200 MHz
increments.
• Press the Enter button and use the
Virtual Keyboard to directly enter the
frequency as shown in the image to
the right.
The following information is displayed for the markers:
• Level – Displays the signal level at the specied frequency for each marker.
• Frequency Delta – Displays the frequency delta between the two markers.
• Frequency Peak – Displays the frequency of the peak signal level in the return
spectrum.
• Level Peak – Displays the peak signal level in the return spectrum.
• Level Delta – Displays the signal level difference between the minimum and maximum
level values in the return spectrum.
Marker Adjustment
 Loading...