D2 Drive User Guide v1.8 6. Drive Tuning
HIWIN Mikrosystem Corp. 155
6.4. Data collection
In addition to using “Scope” to observe physical quantities of each drive, there is a tool to
provide more setting options for data capture, and more advanced graphical display and
processing functions. The “Data collection” function allows users to set the sampling time, as
well as conditional triggers to start and stop the data capture.
6.4.1. Function description
By using the “Scope” function of “Open recode window” shown in Fig. 6-7, the program will
automatically set the selected physical quantity for the follow-up data capture. The main
function is as follows.
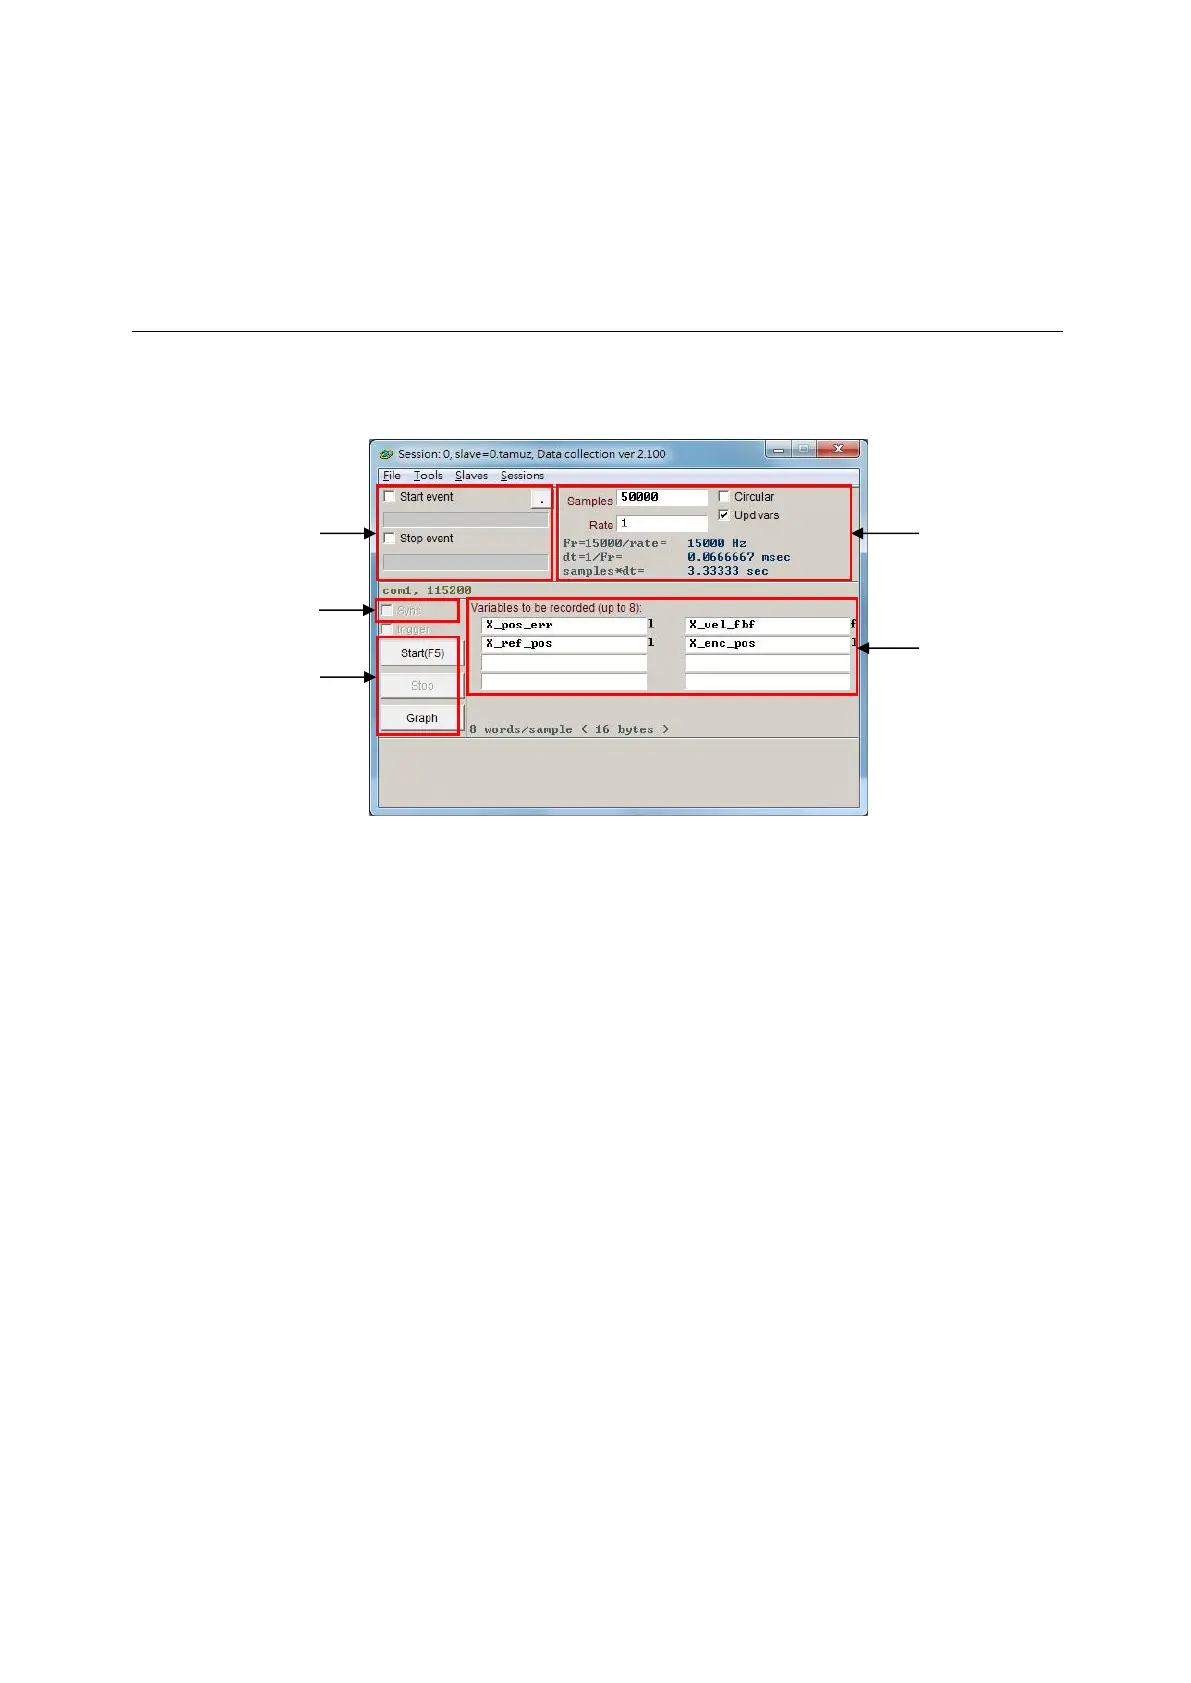
Fig. 6-8 Data collection
○1 Sampling frequency (“Rate”) and the number of samples (“Samples”):
- Samples: The number of samples.
- Rate: Determine the sampling frequency. For example, if “Rate” is set to 1, the sampling
frequency is 15,000 Hz; while when it is set to 2, the sampling frequency is 7,500 Hz.
The sampling frequency can only be up to 15,000 Hz. If too much data is collected, the
data collection may be early completed due to the limit of communication bandwidth.
Reducing the number of collected physical quantities can solve this phenomenon.
- Dt: Sampling time.
- Samples*dt: Total time of data collection. If users want to increase the total time of data
collection, simply increase “Samples”.
○2 It is the internal variable name of the physical quantity of collected data.
○3 Manual collection button. Click the “Start” button to start the collection and click the “Stop”
button to stop the collection. Click the “Graph” button to draw the collected data via
“Plot view”.
○4 Conditional auto collection. Set the start event and stop event for the data collection.
○5 The auto collection option is triggered instantaneously.
Example 1: To capture the graph of one motion cycle
Check “Start event” and set it to “X_run”. Also, check “Stop event” and set it to “X_stop”.
Click the “Start” button after the setting is completed. Now, “Data collection” is on standby.
When the motor is moving, it will start to collect the data; while when the motor stops the
motion, it will stop to collect the data. After the data collection is completed, click the
“Graph” button to draw the graph of one motion cycle.
Example 2: To capture the graph of one speed period
Check “Start event” and set it to “X_vel_fb>0”. Also, check “Stop event” and set it to
“X_vel_fb<0”. Click the “Start” button after the setting is completed. Now, “Data collection”
4
5
3
1
2