D2 Drive User Guide v1.8 6. Drive Tuning
HIWIN Mikrosystem Corp. 161
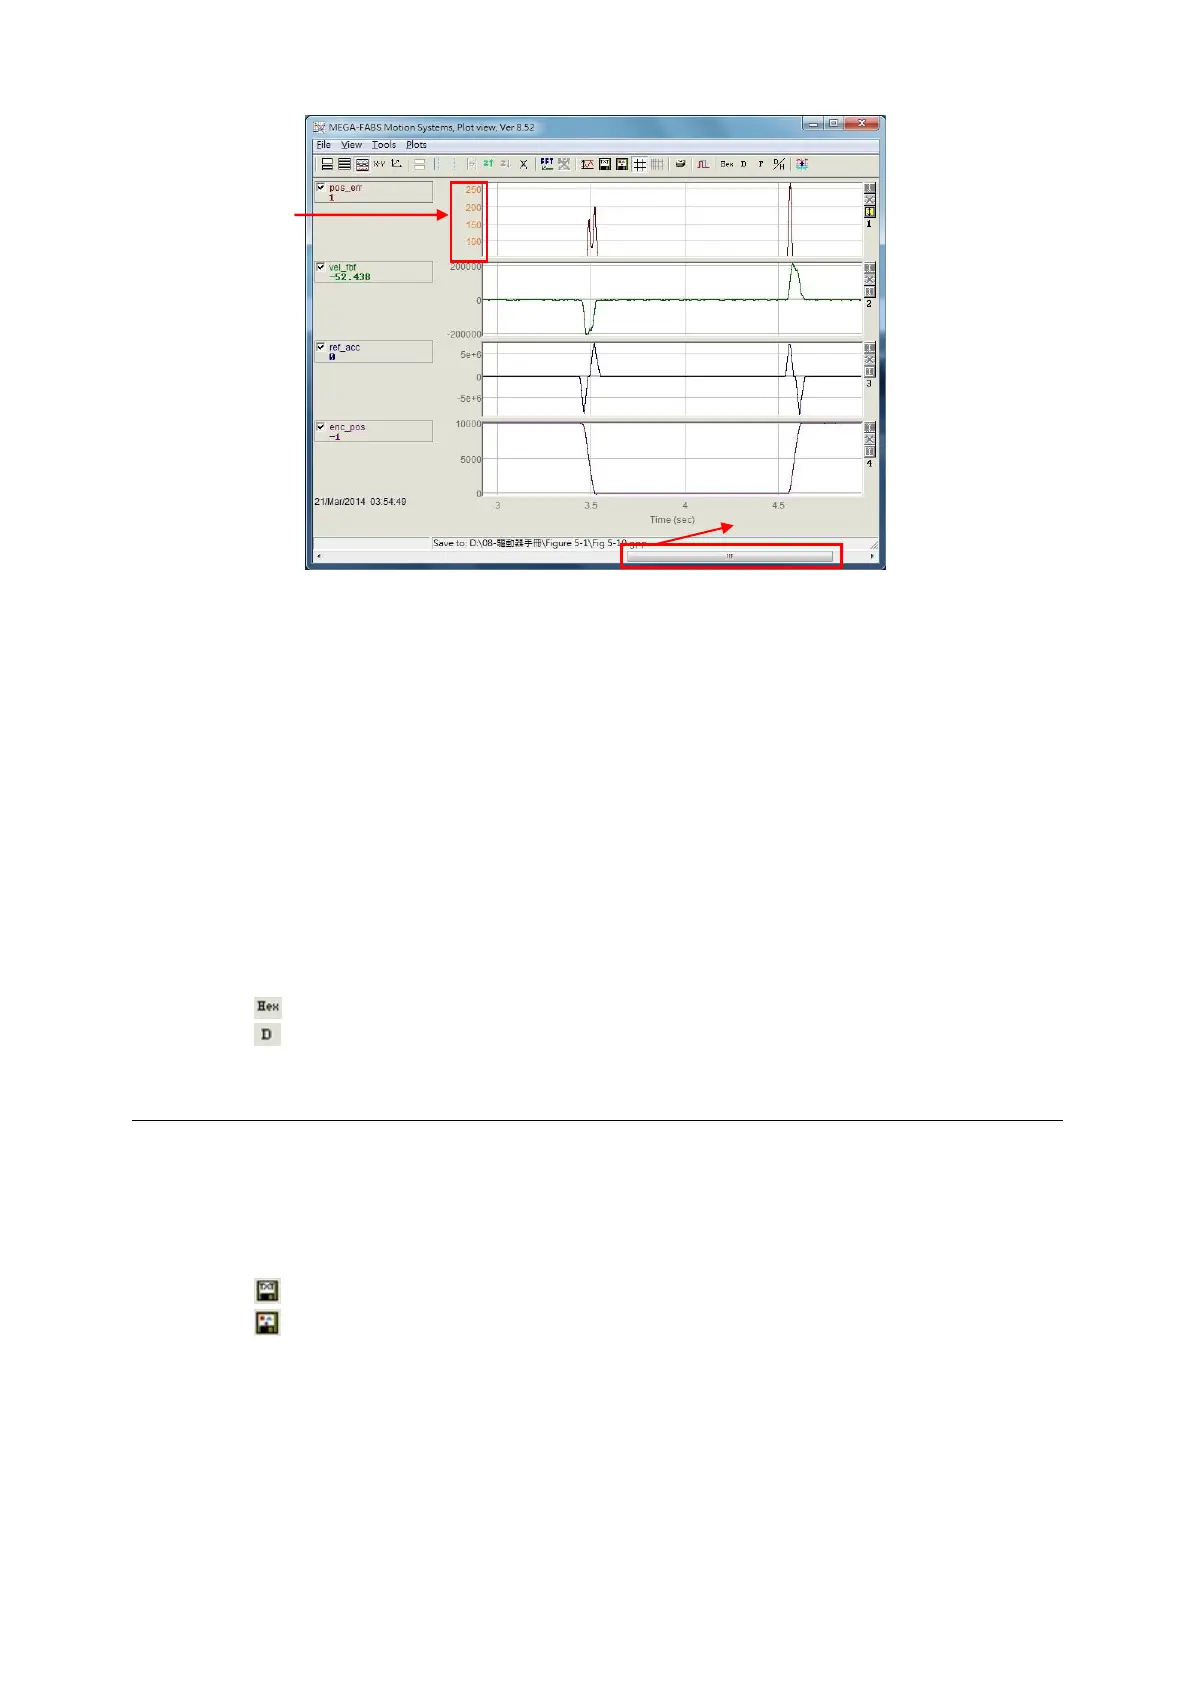
Fig. 6-16
(6) dt, 1/dt, dSamp
When the interval is framed by using the blue solid-line and dotted-line cursors, values of
“dt”, “1/dt”, and “dSamp” will appear at the bottom of graphic display area. Here, “dt” is the
time in the interval and “dSamp” is the sampling number in the interval, as shown in Fig.
6-12.
(7) Display a physical quantity on different channels
To move a physical quantity to another channel for display, click the physical quantity to
present a dotted-line box, and then drag it to another channel.
(8) Display the value of physical quantity
When the blue solid-line cursor is moved to a specific point in time, the value of physical
quantity at this time will be displayed at the bottom of this physical quantity. The value is
displayed in decimal or hexadecimal, as shown in Fig. 6-12. The related icon on the main
toolbar area is described as follows.
- : Display the value in hexadecimal.
- : Display the value in decimal.
6.5.2. Save/open file
In “Plot view”, the saved-file type can be divided into the text file (.txt), picture file (.bmp), and
special “Plot view” file (.gpp). The .txt file saves the value of each physical quantity within the
collection time; the .bmp file saves the graph of all physical quantities as a figure; while
the .gpp file is the only file allowed to be opened in “Plot view”. Therefore, if the file will be
re-opened via “Plot view” in the future, remember to save it as .gpp file. The related icon of
saving as .txt file and .bmp file on the main toolbar area is described as follows.
- : Save the value of physical quantities as a .txt text file.
- : Save the graph of physical quantities as a .bmp figure file.
The .gpp file of “Plot view” is read or opened via the option of “Save” or “Open” in the function
menu of “File”, as shown in Fig. 6-17.
Parameters are
not automatically
adjusted to fit the
graph.
Slider movement direction.
 Loading...