Roche Diagnostics
Operator’s Manual · Version 3.4 B-81
Cedex Bio analyzer 5 Daily operation
Performing QC
Interpreting the QC history
The QC history provides—on individual screens—information on the QC results of
the current and the previous calendar month as well as on results that were generated
before the previous month.
A graphic representation of the results provides a convenient way for comparing
results over a period of time.
a To interpret the QC history
1
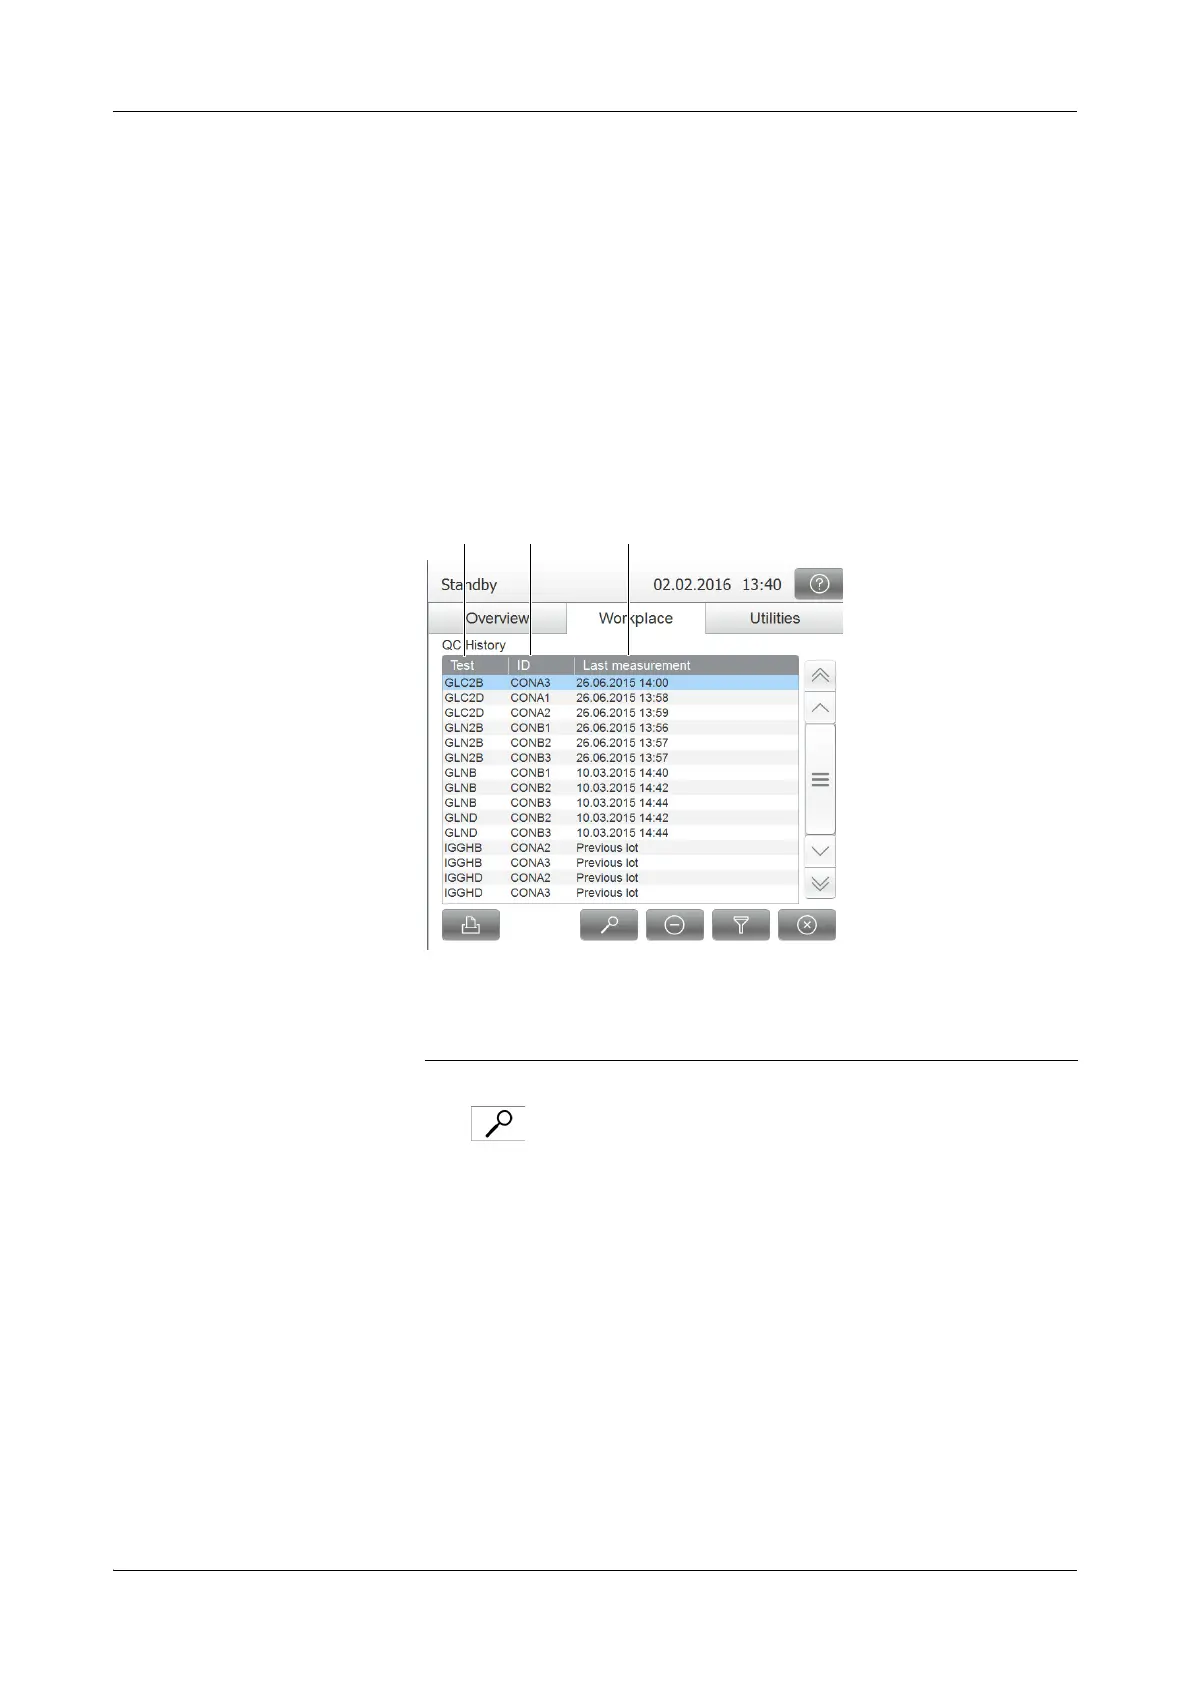
Choose Workp lac e > QC History.
A screen is displayed that contains, one QC result entry for each lot of each test.
2
Press .
A graphic is displayed that shows either the QC results for the current or the
previous month, or those generated before the previous month.
To view the information in the QC History chart better, results are displayed with
rounded value (qualitative display).
Results are shown in the QC History chart as follows:
o ≤0.5s: Result is placed on the middle line.
o ≤1.0s: Result is placed below the invisible 1s line.
o ≤1.5s: Result is placed above the invisible 1s line.
o ≤2.0s: Result is placed below the 2s line.
o ≤2.25s: Result is placed above the 2 line.
o ≤2.5s: Result is placed below the 2.5s line.
o ≤2.75s: Result is placed above the 2.5s line.
o ≤3s: Result is placed below the 3s line.
A Test name.
B Control ID.
C Date of most recent control. measure-
ment. If the control does not belong to
the current lot,
Previous Lot is dis-
played instead of the date.
Figure B-27
 Loading...