458 Graphs & Geometry
Changing an attribute of an object
You can change attributes to change the appearance of objects such as
shapes, lines, graphed functions, and axes.
1. From the Actions menu, choose the Attributes tool.
2. Select the object that you want to change. The list of the attributes
for the selected object displays.
3. Use 9 and : to move through the list of icons for attributes.
4. Highlight the icon for the attribute you want to change and use
7 or 8 to move through the options. For example, highlight the Line
Weight option, and use 7 or 8 to move to Thick, Thin, or Medium.
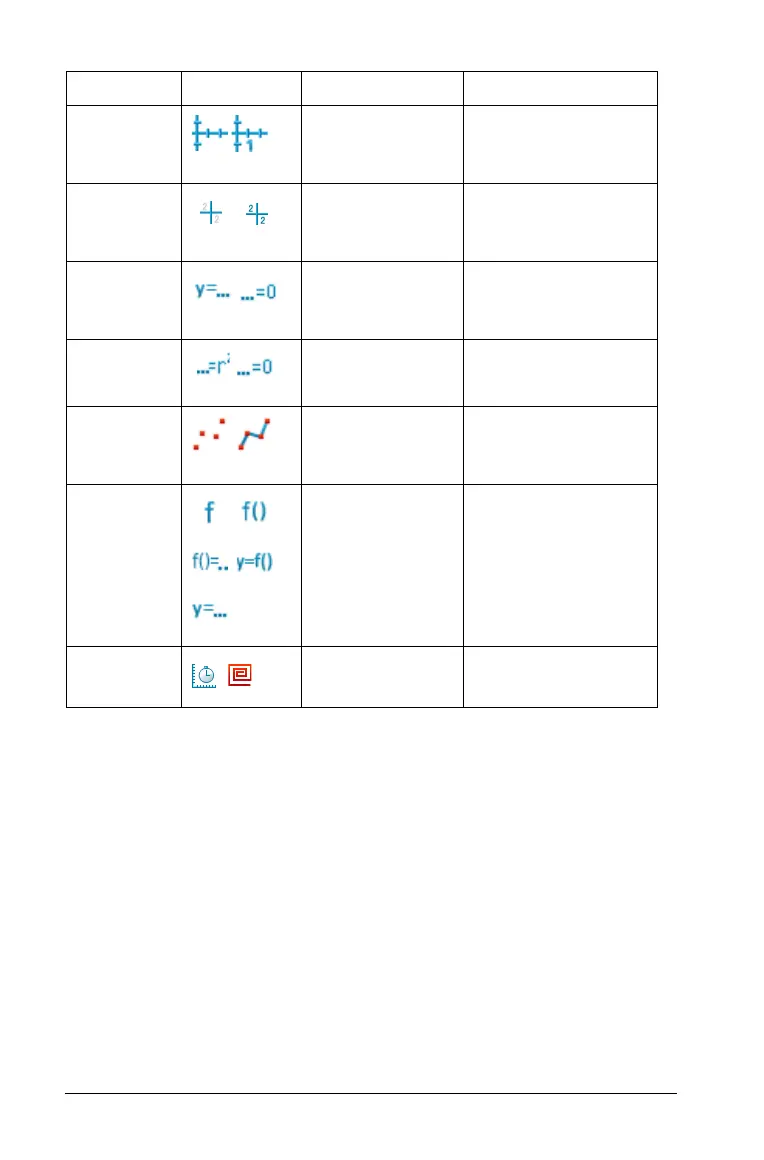
Axes Tic
Labels
Tic labels are
shown, Tic labels
are hidden
Axes
End Values
of Axes
End values are
shown, End
values are hidden
Axes
Line
Equation
Type
Cartesian (y=_),
Canonical (_=0)
Line, Tangent,
Segment, Ray, Vector
Equation
Type
Canonical (...=0),
Cartesian (...=r
2
)
Circle
Plot Points
Points are not
connected, Points
are connected
Scatter Plots
Labels
f, f( ), f( )=,
y=f( ), y=,
Graphed Functions
Sequence
Type
Time plot, Web
plot
Sequence plots
Name Icon(s) Options Available for use on

 Loading...


