Data Collection and Analysis 755
Setting the point display
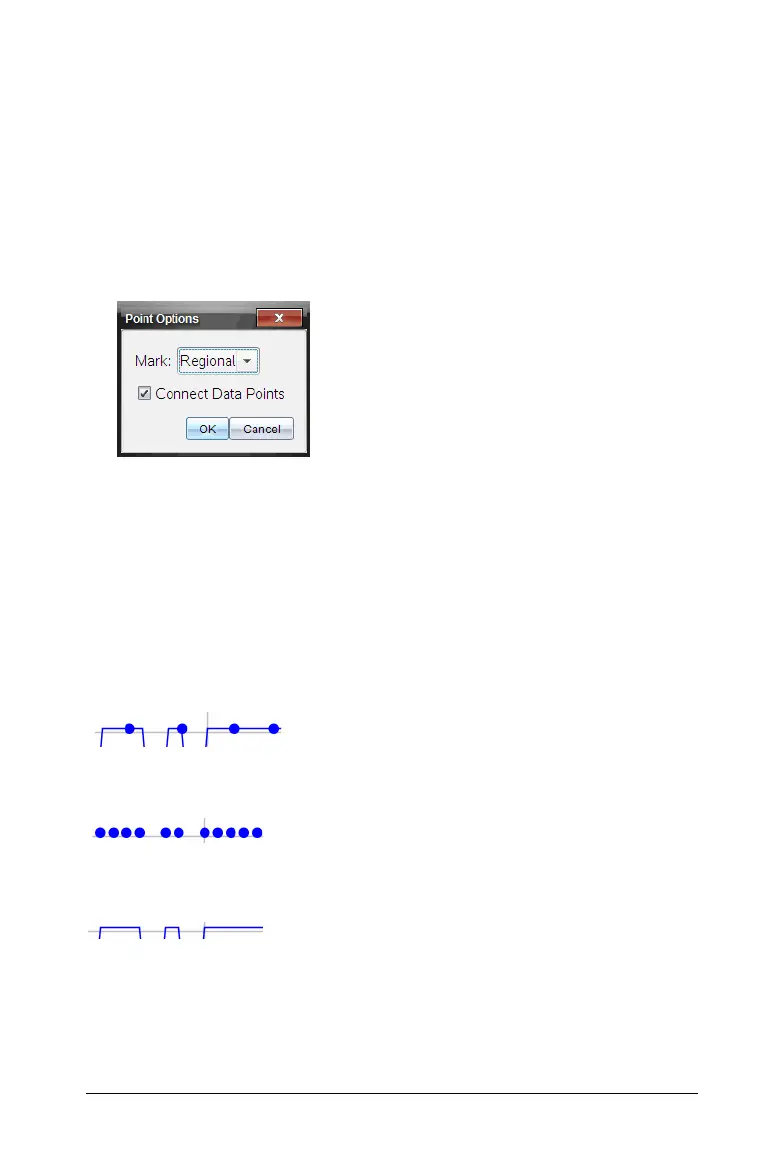
You can adjust the way points are displayed on your graphs.
Point Options
Use this procedure to determine how often marks appear on the graph
and whether to use a connecting line.
1. Select
Options > Point Options.
The Point Options dialog box opens.
2. Select your
Mark option from the drop-down box.
• None - No point protectors.
• Regional - Periodic point protectors.
•
All - Display every data point as a point protector.
3. Select or deselect Connect Data Points.
Selecting Connect Data Points displays a line between points.
The following shows examples of some of the point Mark options.
Regional
Connect Data Points - Selected
All
Connect Data Points - not selected
None
Connect Data Points - Selected

 Loading...


