628 Using Data & Statistics
Showing a residual plot
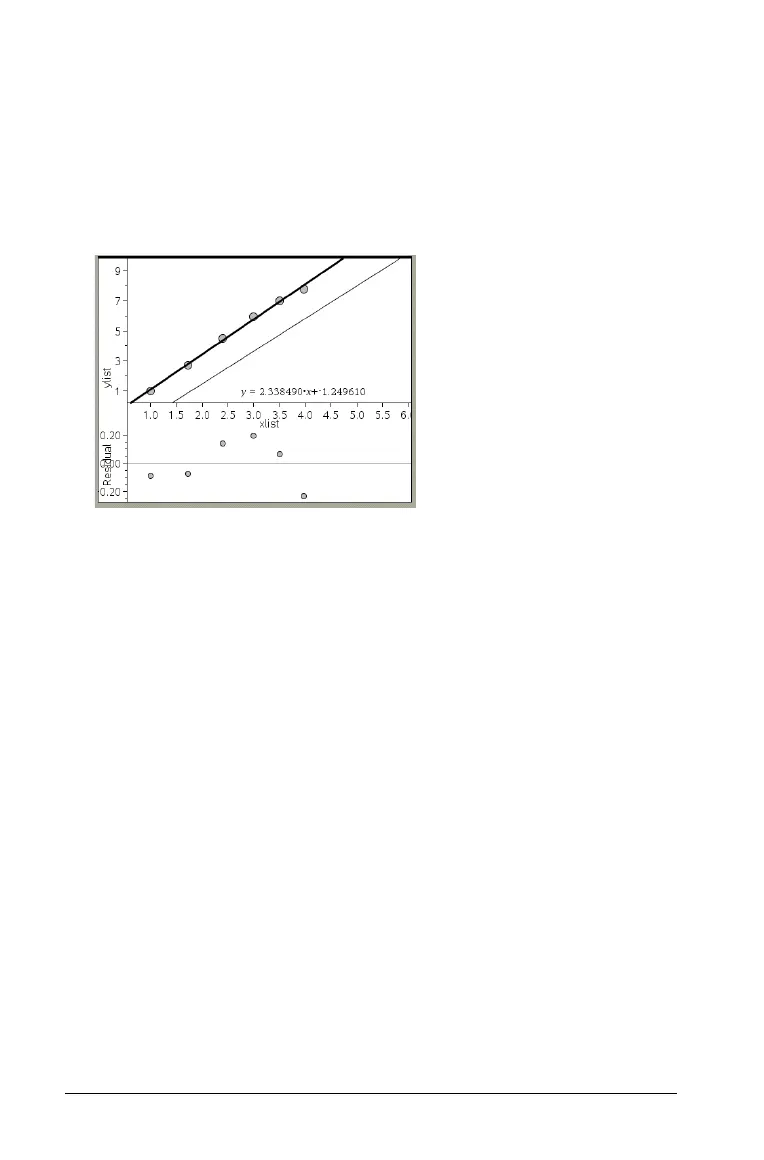
You can show a residual plot to determine how well a line fits data. The
work area must include a scatter plot and one or more movable lines,
regressions, or plotted functions for
Show Residual Plot to be available.
` With a scatter plot, line of regression, and/or movable line in the
work area, select the
Analyze menu, and select Show Residual Plot >
Residuals.
Notes:
• With multiple regressions or functions and movable lines plotted, you
can select each by clicking the line to show its residual plot.
• Click and hold a dot on the residual plot to see the residual.
• The residual plot for the selected regression or function displays in
the work area.
• For consistency in comparing sets of data, residual plots do not rescale
when you move from one function or regression to another.
• Select a function or regression before a showing residual plot. If no
function or regression is selected and there are several plotted, Data
& Statistics arbitrarily selects the function or regression for showing
the residual plot.
• Axes can be adjusted by clicking and dragging.
Removing a residual plot
` With a scatter plot, line of regression, and/or movable line in the
work area, select the Analyze menu, and select Hide Residual Plot.
Using Window/Zoom tools
Use the Window/Zoom tools to redefine the graph to better view points
of interest. The Window/Zoom tools include:

 Loading...


