744 Data Collection and Analysis
This section’s topics include:
• Showing graphs
• Adding a title to a graph
• Selecting a data set to plot
• Setting min and max axis ranges
• Selecting a Data Set to plot
• Using autoscale
• Using zoom in and zoom out
• Selecting a range
• Setting the point display
• Selecting an independent variable column
• Selecting a dependent variable column
Showing graphs
The Show Graph menu option is used to show separate graphs when you:
• Have a sensor that plots more than one column of data.
• When multiple sensors having different defined units are used at the
same time.
You can select to show the top graph, bottom graph, or both. In these
conditions, the default is to show both graphs.
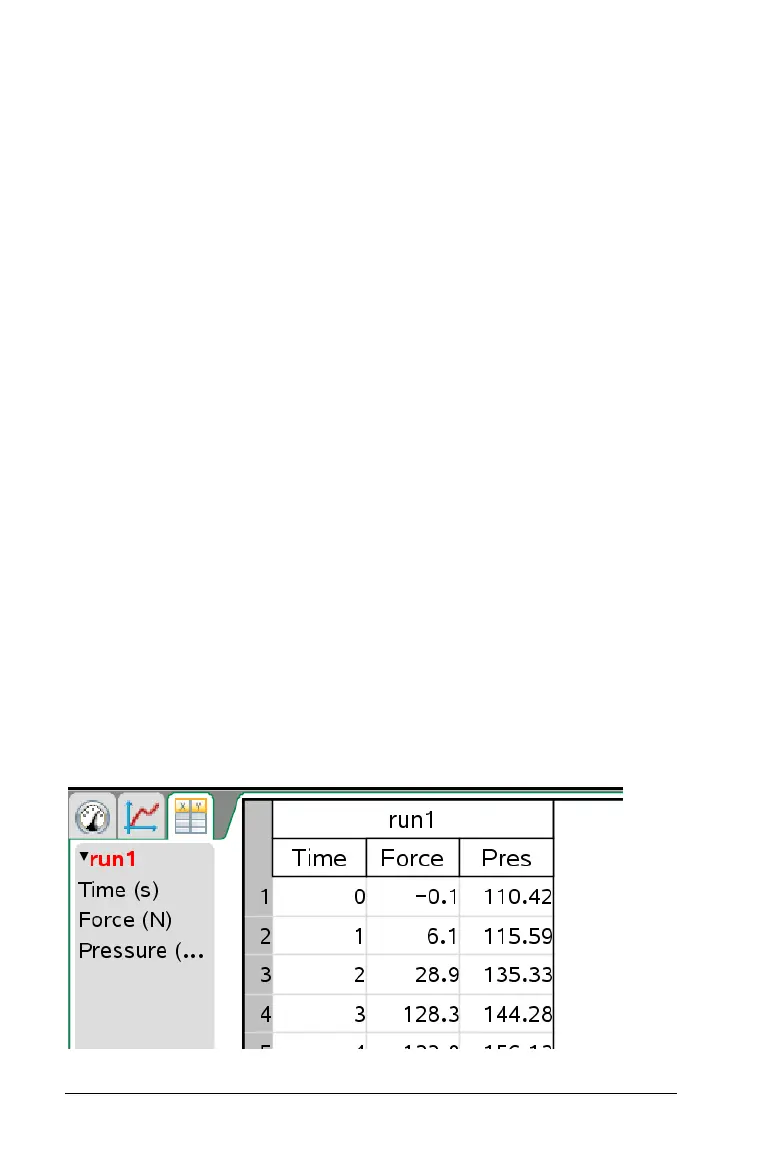
In this example, two sensors (the Gas Pressure sensor and the Hand
Dynamometer) were used in the same run. The following image shows
the columns Time, Force, and Pressure in the Table View to illustrate why
two graphs are shown.
 Loading...


