786 Data Collection and Analysis
Using Motion Match
Use this option to create a randomly generated plot on position vs. time
or velocity vs. time graphs.
This feature is only available when using a motion detector like the
CBR 2™ sensor or the Go!Motion® sensor.
Generating a Motion Match plot
To generate a plot:
1. Attach the motion detector.
2. Select
View > Graph or click .
3. Select
Analyze > Motion Match.
4. Select one of the following:
• New Position Match - Generates a random position plot.
•
New Velocity Match - Generates a random velocity plot.
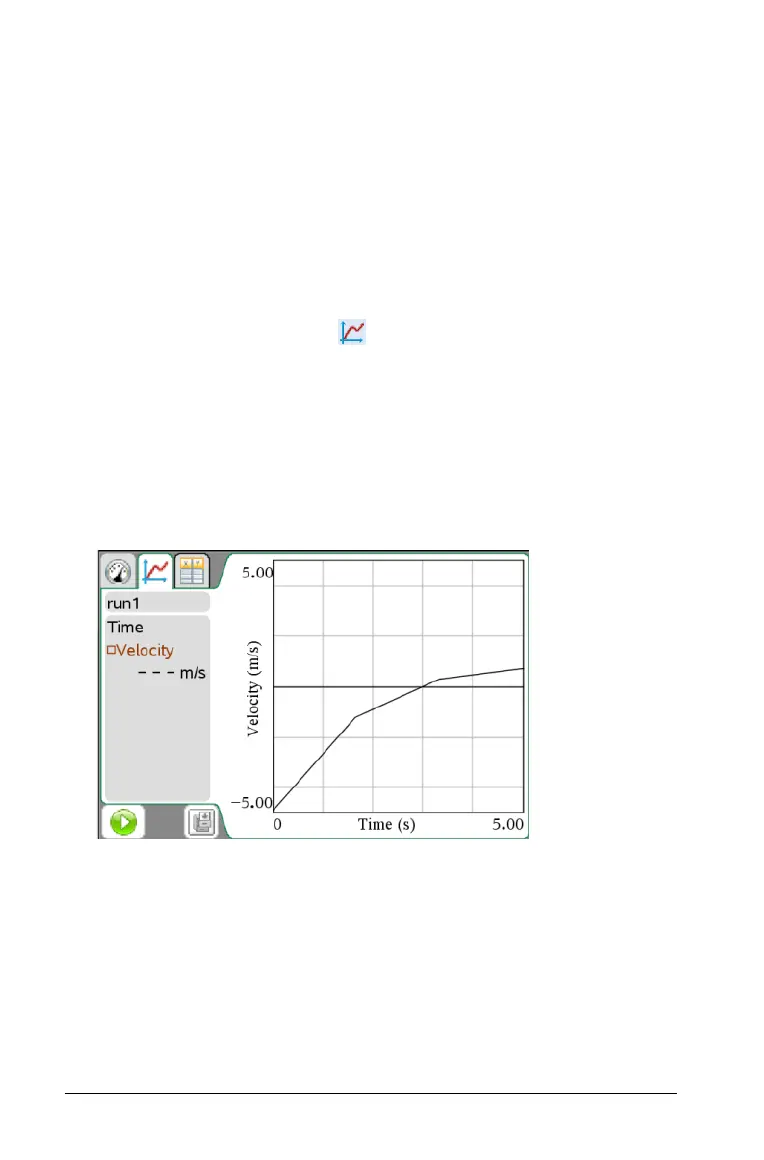
The following image is an example of the Motion Match (New
Velocity Match) generated plot:
Note: You can keep selecting a new position or a new velocity match to
generate a new random plot without removing the existing plot.
Removing a Motion Match plot
To remove the generated plot:
³ Select
Analyze > Motion Match > Remove Match.
 Loading...


