Using Data & Statistics 601
Lists & Spreadsheet application.) The Lists & Spreadsheet
application displays a void as an underscore (“_”), and
Data & Statistics plots no data point for a void cell.
Manipulating plotted data
You can manipulate data points on the Data & Statistics work area to
explore their effects. For example, you could explore how a specific
group of values affects the median.
You can move a data point only in directions allowed by its definition. If
a list is defined with a formula in Lists & Spreadsheet, the points in
Data & Statistics may not move because of the formula’s restrictions. For
example, you can manipulate a plot that represents the result of y=x, but
you can only move along a line.
You cannot move points that represent data in a locked variable or data
that represents a categorical value.
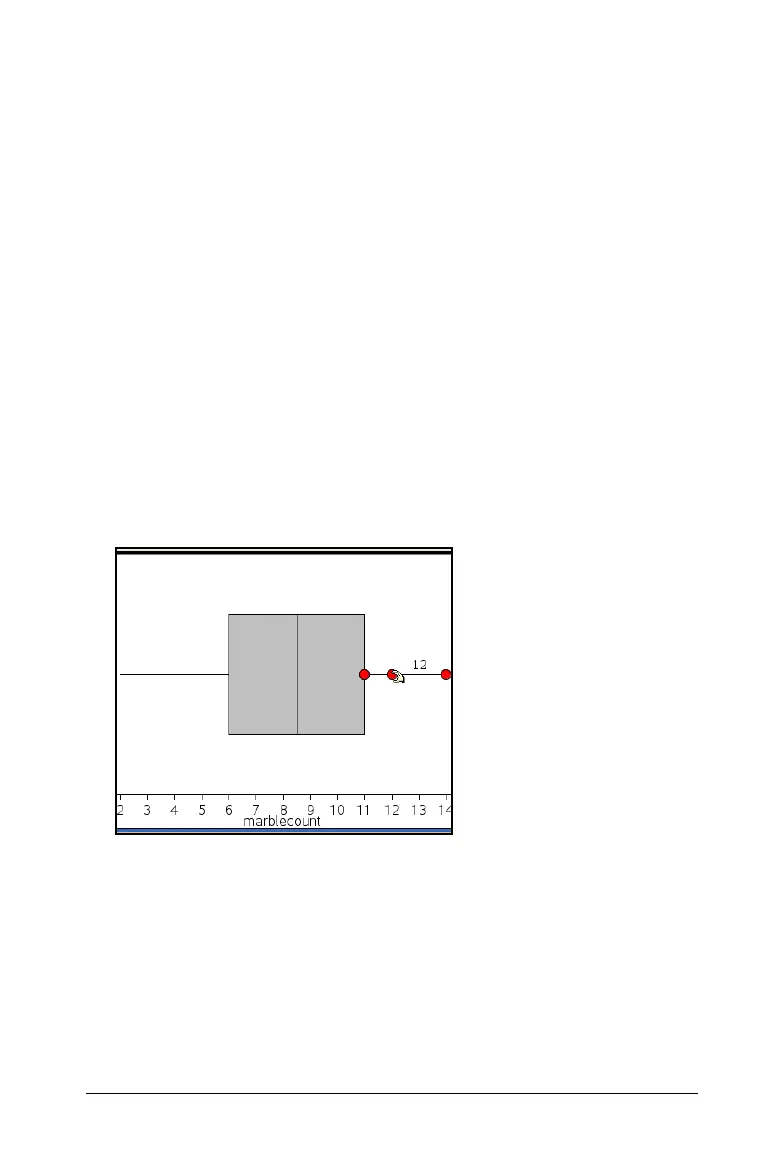
To move plotted data:
1. On the Data & Statistics work area, click a representation of data—
such as a histogram bin or a whisker of a box plot—that is not locked
or restricted by a formula.
The pointer changes to an open hand to show that the data can be
moved.
2. Drag the selection to explore how different values of the point affect
the plot.
As you drag, the changing value displays on the work area.
Overview of raw and summary data
You can create plots directly from raw data or from a summary table.

 Loading...


