EasyManuals Logo
Home>Texas Instruments>Calculator>TINSPIRE

Texas Instruments TINSPIRE User Manual

Texas Instruments TINSPIRE
876 pages
To Next Page IconTo Next Page
To Previous Page IconTo Previous Page
Page #797 background imageLoading...
Page #797 background image
Data Collection and Analysis 785
2. Select the number of points from the drop-down menu.
3. Click OK.
Drawing a predictive plot
Use this option to draw the predicted outcome of an experiment by
adding points to your graph.
Drawing the prediction
To draw the prediction:
1. Select
Analyze > Draw Prediction > Draw.
2. Move your cursor over the graph, clicking at each area you want to
place the point.
3. Click the Esc key to release.
Handheld: Press d to release.
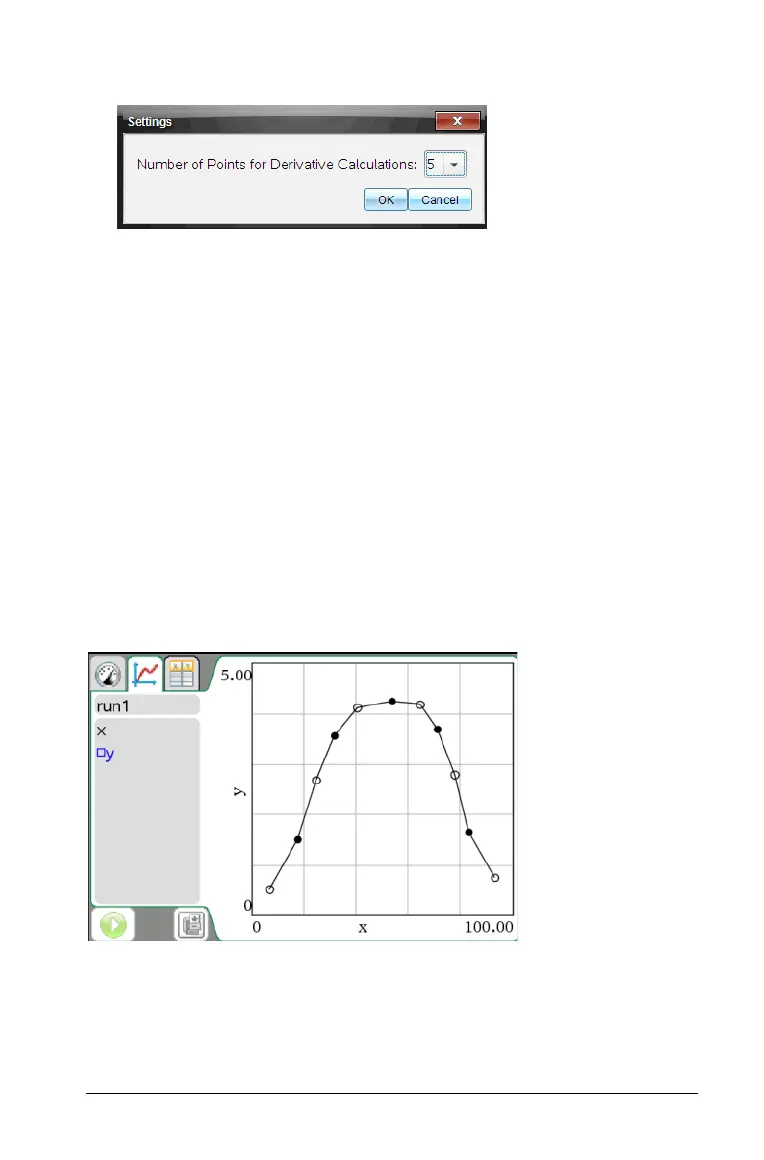
The following image is an example of a drawn prediction.
Clearing the prediction
To clear the drawn prediction:
³ Select
Analyze > Draw Prediction > Clear.

Table of Contents

Other manuals for Texas Instruments TINSPIRE

Questions and Answers:

Question and Answer IconNeed help?

Do you have a question about the Texas Instruments TINSPIRE and is the answer not in the manual?

Texas Instruments TINSPIRE Specifications

General IconGeneral
BrandTexas Instruments
ModelTINSPIRE
CategoryCalculator
LanguageEnglish

Related product manuals