570 Using Lists & Spreadsheet
Plotting statistical data
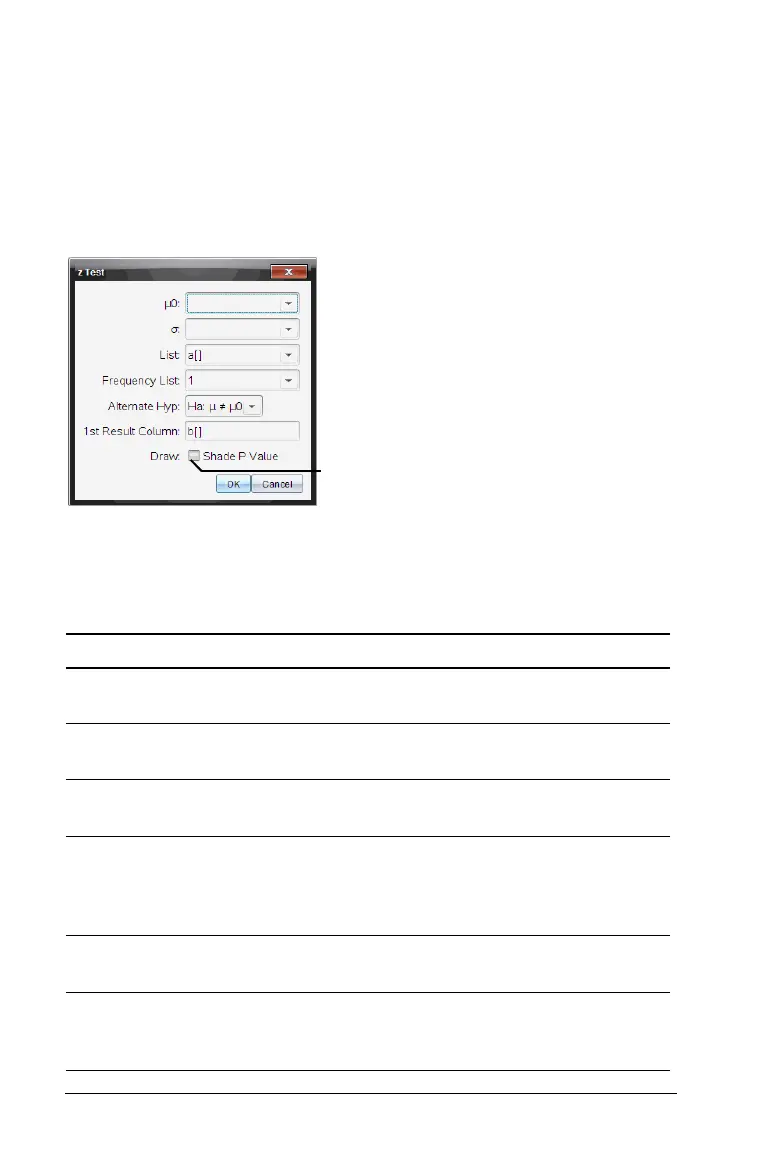
Some statistics wizards include a Draw check box. By default, the box is
not checked. Checking this box creates a Data & Statistics work area on
the page, displays the calculated results in Lists & Spreadsheet, and draws
the results of the statistical analysis in the Data & Statistics work area.
Note: For functions that support the Draw option, the option is available
only if you enter the function in a column formula cell.
Statistics Input Descriptions
The following table describes the different inputs used in
Lists & Spreadsheet wizards.
Input Description
m
0
Hypothesized value of the population mean that
you are testing.
s The known population standard deviation; must be
a real number > 0.
List
The name of the list containing the data you are
testing.
Frequency List
The name of the list containing the frequency
values for the data in
List. Default=1. All elements
must be integers | 0. The frequency values can also
be typed as a list, in the format {1, 1, 3, 2}.
v,
Sx, n Summary statistics (mean, standard deviation, and
sample size) for the one-sample tests and intervals.
s
1 The known population standard deviation from the
first population for the two-sample tests and
intervals. Must be a real number > 0.
Draw check box
(as shown in the
zTest wizard).

 Loading...


