Using Data & Statistics 627
1. With a scatter plot or X-Y line plot of two variables on the work area,
select the
Analyze menu, choose Regression and view the list of
regressions.
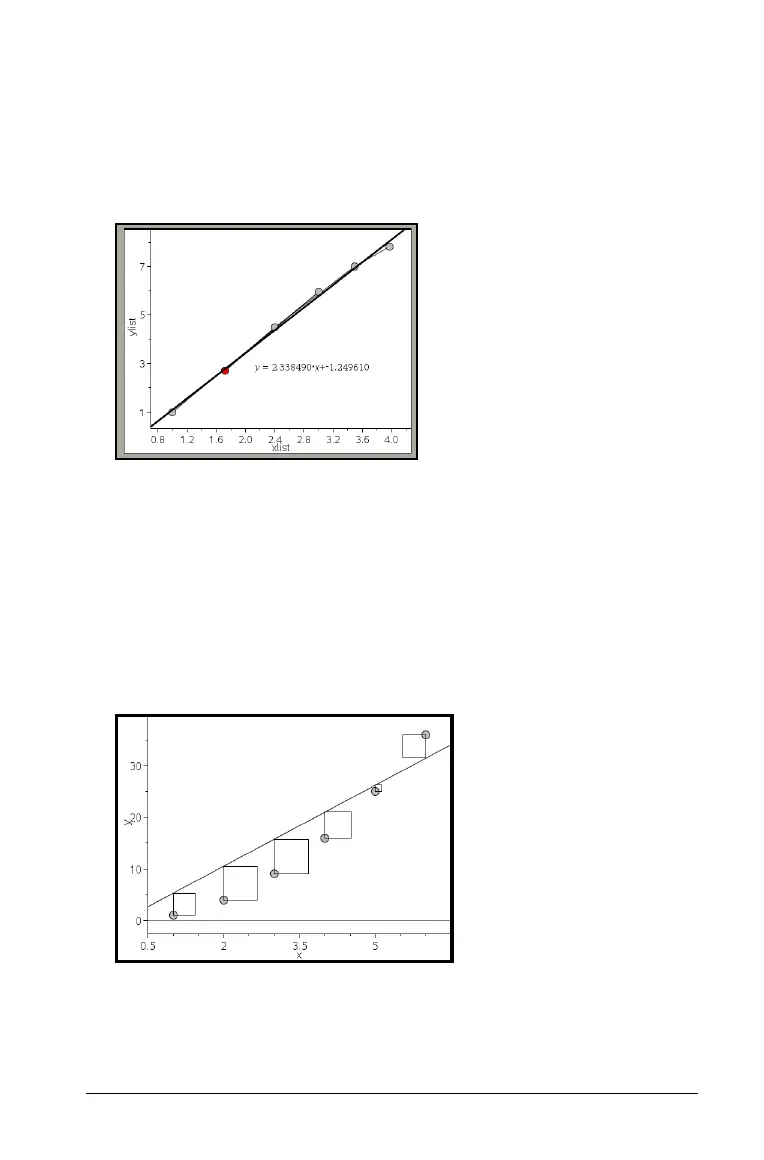
2. Click the type of regression line to show. For example, choose Show
Linear (mx+b)
to plot a linear regression line as shown in the
following example.
When the line of regression is selected, the expression for the line
displays.
Showing residual squares
You can display residual squares on a plot. Residual squares can help you
assess the appropriateness of the model for your data.
Note: This tool is only available when a regression or movable line is
present in the work area.
` From the Analyze menu, select Residuals > Show Residual Squares.
The sum of squares is updated as the line or data changes.

 Loading...


