626 Using Data & Statistics
The number at the end of the equation changes to show the change
in the intercept.
Note: The movable line is stored as a function that can be used for
prediction in the Calculator application.
Locking the intercept at zero
You can lock the intercept of the movable line at zero.
` From the
Analyze menu, select Lock Intercept at Zero.
You can unlock the intercept by choosing
Unlock Movable Line
Intercept
on the Analyze menu.
Tracing a movable line
You can trace a movable line to predict and analyze values.
1. Click the line.
The cursor changes.
2. From the Analyze menu, select Graph Trace to enable Trace mode for
the line. Rotation of the line is not supported in Trace mode.
3. Press
¡ or ¢ (left or right arrow keys) to trace the movable line.
If the plotted variables change, points on the graph and the line are
updated automatically.
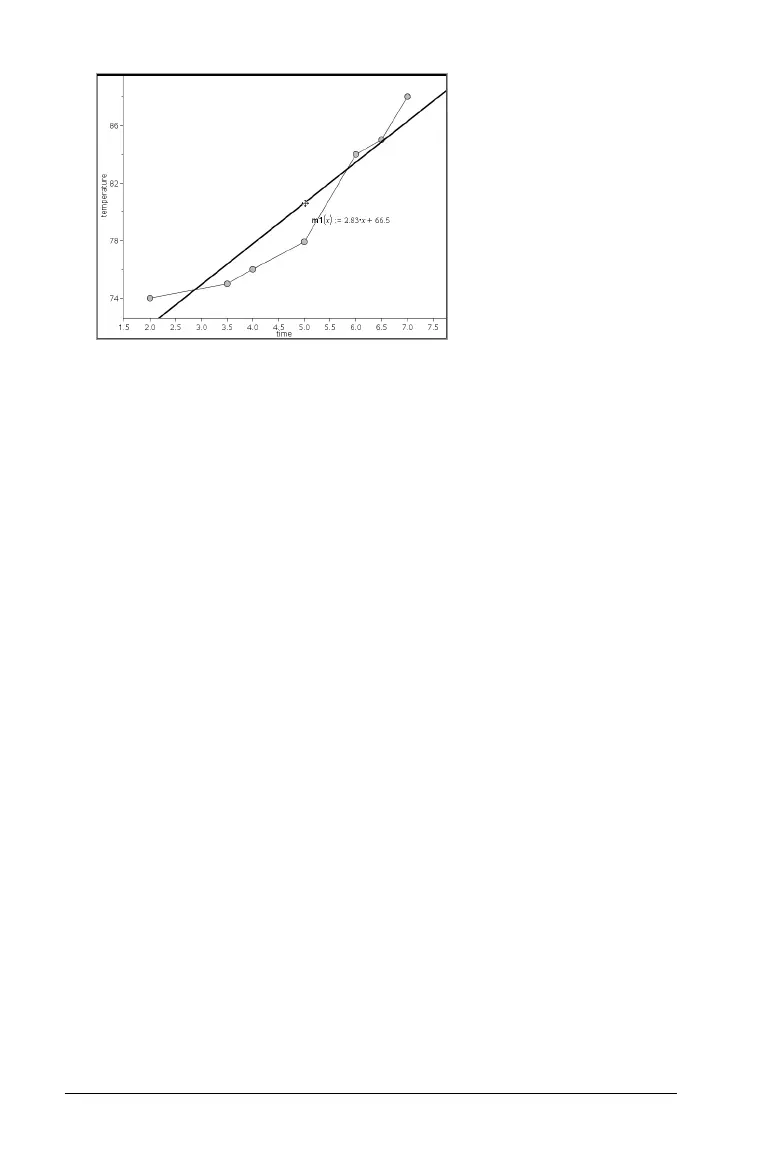
Showing a line of regression
You can show a line of regression when you have a scatter plot or an X-Y
line plot on the work area. Studying the line of regression can help you
understand the relationship between two variables.

 Loading...


