Using Data & Statistics 625
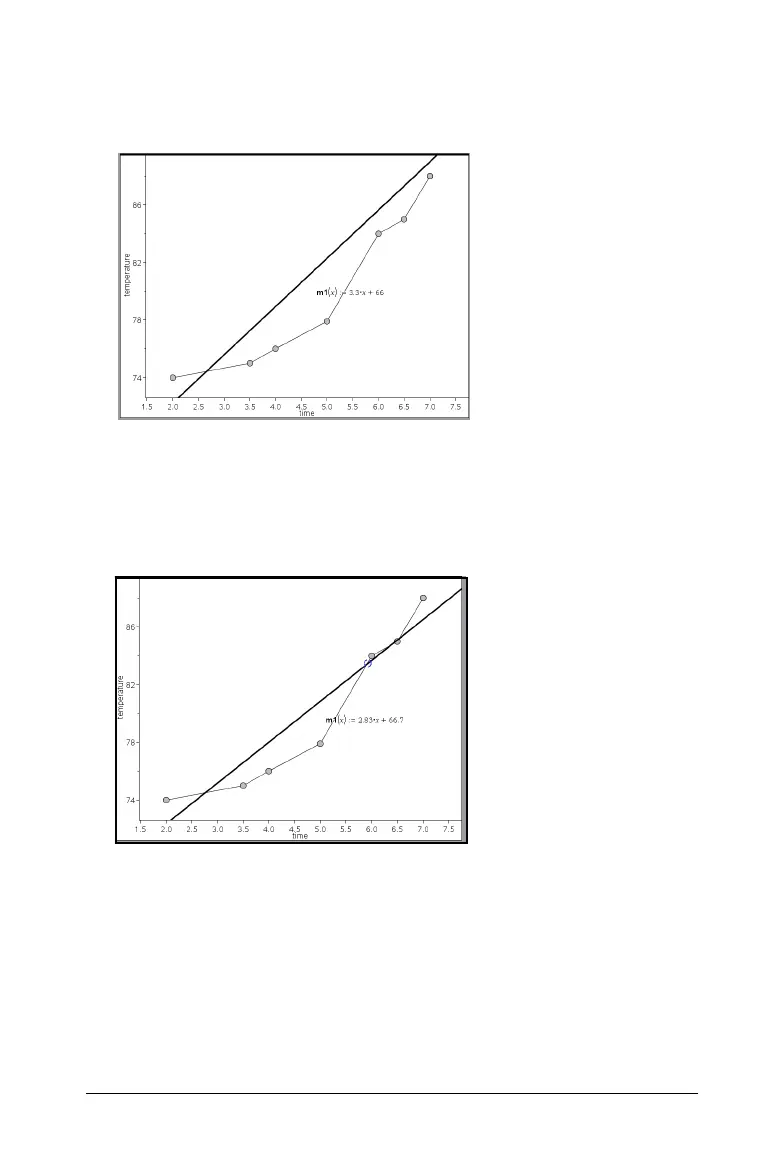
The movable line displays and is labeled with a function that
describes it. For this example, Data & Statistics stores the expression
for the movable line in the variable m1.
Rotating a movable line
1. Click and grab on either end of the line.
The cursor changes to é.
2. Drag to rotate and change the slope of the line.
The function m1(x) is updated for the changes in the position of the
movable line.
Changing the intercept
1. Click in the middle of the movable line.
The cursor changes to ö.
2. Drag to change the intercept.

 Loading...


