Graphs & Geometry 469
• Geometry Trace - trail of functions or objects.
See Using the Plane Geometry View for details about using the Geometry
Trace tool.
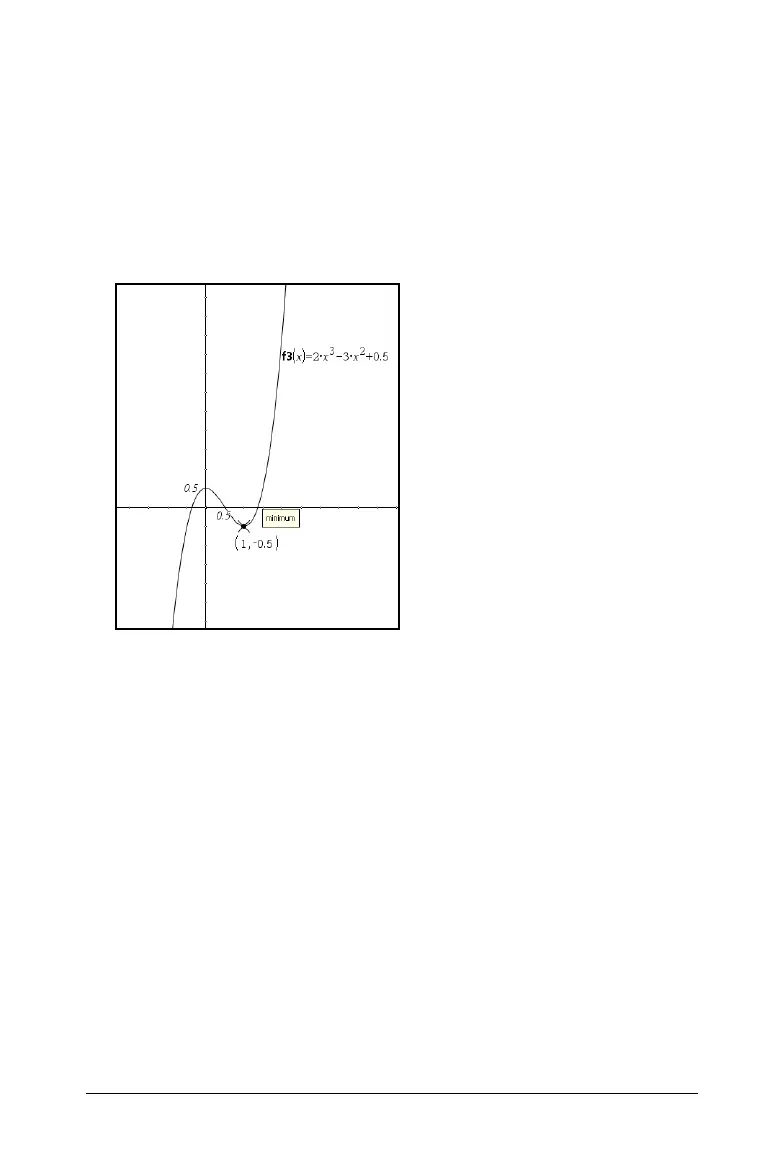
Tracing a graph or plot
Graph Trace moves over the points of a graph or plot and displays value
information.
1. From the
Trace menu, select Graph Trace:
2. (Optional) From the
Trace menu, select Trace Step to change the step
increment.
3. Use Graph Trace to explore a graph or plot in the following ways:
– Move to a point and hover to move the trace cursor to that point.
– Press 7 or 8 to move the trace cursor from point to point and
display the coordinates or values of each point.
– Press 9 or : to move from one graph to another. The point’s
coordinates update to reflect the new location of the trace. The
trace cursor is positioned on the point of the new graph or plot
with the closest x value to the last point identified on the
previously traced graph. You can trace multiple functions as
described in Tracing all graphs.
– Type a number and press
· to move the trace cursor to that
independent value on the graph or plot.
 Loading...


