608 Using Data & Statistics
Note: It is up to you to set the data and bins in a meaningful way
when using summary data.
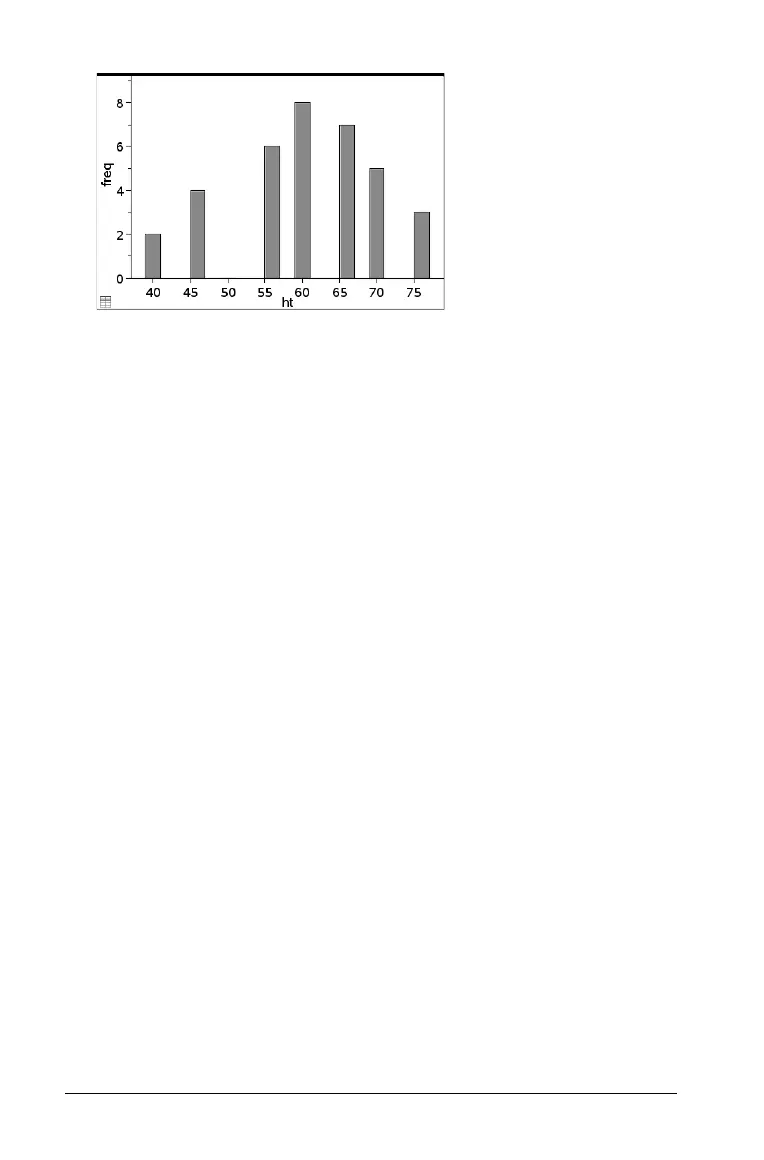
4. Explore the data in the bins of the histogram.
– Hover over a bin to see the information for that bin.
– Adjust the width by dragging the side of a bin.
– Click a bin to select it. Click the bin again to deselect it.
– Activate the Graph Trace tool and press 7 or 8 tto move across the
bins and display values.
Modifying histogram bins
1. To modify histogram bins, select Histogram Properties on the Plot
Properties
menu and choose Bin Settings.
The Bin Settings dialog displays.
2. Type values to set width and alignment of the bins that represent
histogram data:
– To specify bin width, type a value in
Width.
– To specify bin placement, type a value in Alignment.
Note: You can also modify the bins by clicking and grabbing the edge
of any bin and dragging it to the desired size.
3. Click OK to apply the changes.
The bins of the histogram are redrawn using the values set. Both the
data represented by the bins and the value you type for the
alignment affect the placement of bins on the scale.
Adjusting the histogram scale of raw data
1. On the Plot Properties menu, select Histogram Properties and
choose
Histogram Scale.
The
Histogram Scale dialog displays.
 Loading...


