Using Data & Statistics 633
Note: Show Normal PDF is available only when histogram is the plot
type.
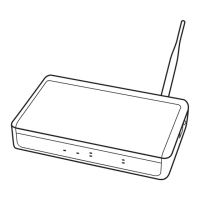
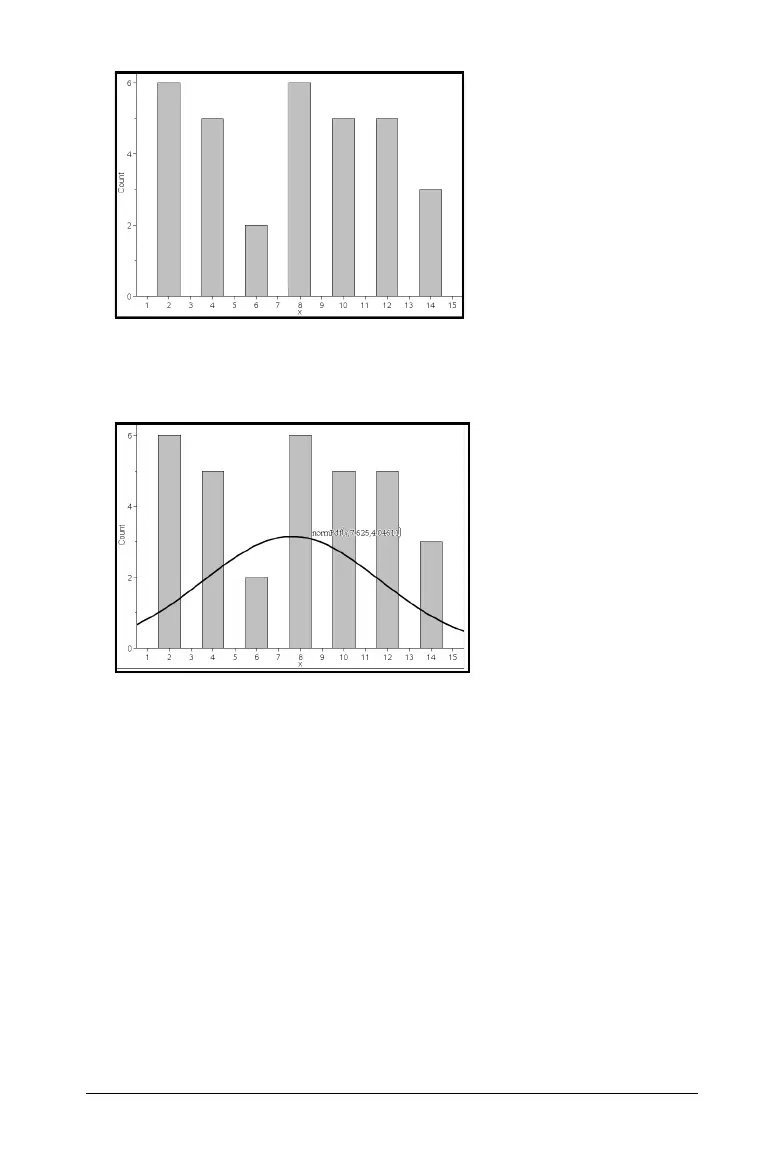
3. From the Analyze menu, select Show Normal PDF.
The normal PDF for the graph plots in the work area. The expression
used to calculate the PDF displays when selected.
You can select
Hide Normal PDF on the Analyze menu to remove the
PDF.
Using Shade Under Function
Use Shade Under Function to find the area of a selected region under a
function graphed in the work area.
1. Select any function graphed in the Data & Statistics work area. For
example, select a previously graphed normal PDF.
2. From the
Analyze menu, select Shade Under Function.
The cursor becomes a dotted vertical line and the boundary +/- ˆ
displays when you position the mouse near the boundary on the left
or right. You can click when ˆ displays to set it as a boundary.
 Loading...


