Chapter 7 377
ADC/Interface Section
A3 Assembly Video Circuits
Rosenfell Detector
Refer to function block S of A3 Interface Assembly Schematic Diagram
(sheet 4 of 6) in the
HP 8560 E-Series Spectrum Analyzer Component Level
Information.
If both HPOS_HLDNG and HNEG_HLDNG are high during the same
bucket, HROSENFELL will also be set high. This indicates that the
video signal probably consists of noise, since it rose and fell during the
same period. The HROSENFELL signal is valid only when the
NORMAL (rosenfell) detector mode is selected.
1. Remove anything connected to the HP 8560E/EC front panel INPUT
50 Ω connector. Press
PRESET on the HP 8560E/EC and set the
controls as follows:
Center frequency .................................................. 300MHz
Span .............................................................................. 0Hz
Sweep time ....................................................................... 5s
Detector mode ......................................................NORMAL
2. Check LPOS_RST and LNEG_RST as described in "Peak Detector
Reset."
3. Check A3U423 pin 4 for two low-going 3.3 µs pulses 40 µs apart
occurring every 130 µs.
4. Check that HROSENFELL (A3U610 pin 6) has two pulses spaced
approximately 40 µs apart and then a third pulse 60 µs from the
second pulse. Each pulse should be approximately 10 µs wide and
low-going.
5. Monitor HROSENFELL with an oscilloscope while reducing the
video bandwidth from 1 MHz to 1 kHz.
6. As the video bandwidth is decreased to 1 kHz, the HROSENFELL
line should increasingly show a low logic level. With a video
bandwidth of 1 kHz, a nearly flat line should be displayed on the
CRT.
7. Set the sweep time to 50 ms. Externally trigger the oscilloscope
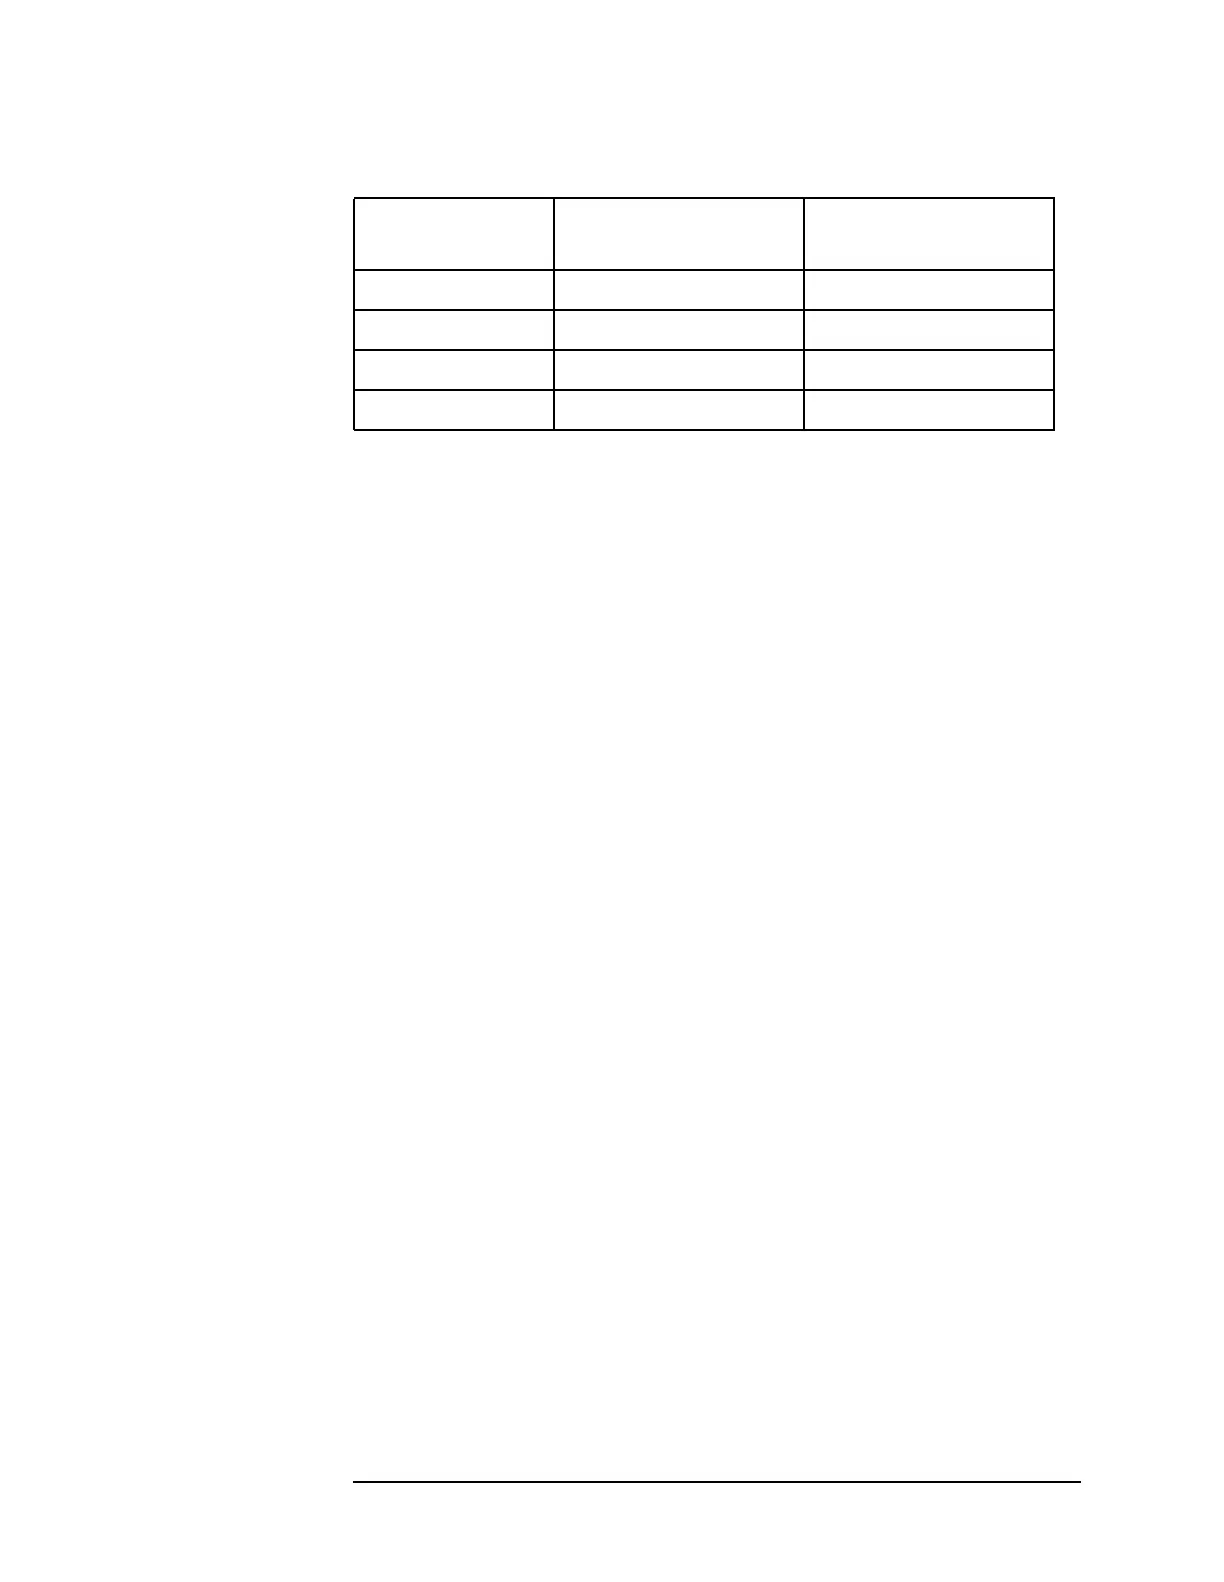
Table 7-8 HMUX_SELO/1 versus Detector Mode
Detector Mode HMUX_SEL0
(U408 pin 3)
HMUX_SEL1
(U408 pin 9)
NORMAL 15 µs pulse every 128 µs40µs pulse every 128 µs
SAMPLE H H
POS PEAK H L
NEG PEAK L H

 Loading...


