Chapter 8 423
IF Section
Log Amplifier Assembly (P/O A4)
Total gain can be measured by injecting the specified power into A4J3
and measuring the total gain provided by A4U201C and A4U201E. The
following procedure provides a means of troubleshooting the linear
amplifiers:
1. On the spectrum analyzer, press
PRESET, SPAN, ZERO
SPAN, CAL, IF ADJ OFF, FREQUENCY, 1 GHz, AMPLITUDE, −50 dBm,
LINEAR, MORE, AMPTD
UNITS, dBm, and AMPLITUDE.
2. Disconnect W27 (coax 3) from A4J3 and connect the output of a
signal generator to A4J3.
3. Set the signal generator controls as follows:
Amplitude................................................................ +6dBm
Frequency ............................................................ 10.7MHz
4. Simultaneously decrease the signal generator output and spectrum
analyzer REF LVL in 10 dB steps to −90 dBm. At each step, the
signal displayed on the spectrum analyzer should be within one
division of the previous position.
5. If a problem exists, isolate it by comparing the actual gain of
A4U201C and A4U201E with those listed in the gain guidelines,
above.
6. Reconnect W27 (coax 3) to A4J3.
Video Offset
Refer to function block P of A4 log amplifier schematic diagram (sheet 3
of 4) in the
HP 8560 E-Series Spectrum Analyzer Component Level
Information.
The circuit provides a programmable video offset, with a step size of 5
mV, from −300 mV to +900 mV.
1. On the spectrum analyzer, press
PRESET, SPAN, ZERO
SPAN, FREQUENCY, 1 GHz, AMPLITUDE, −50 dBm, CAL, IF ADJ OFF.
2. Disconnect W27 (coax 3) from A4J3 and connect a signal generator
to A4J3.
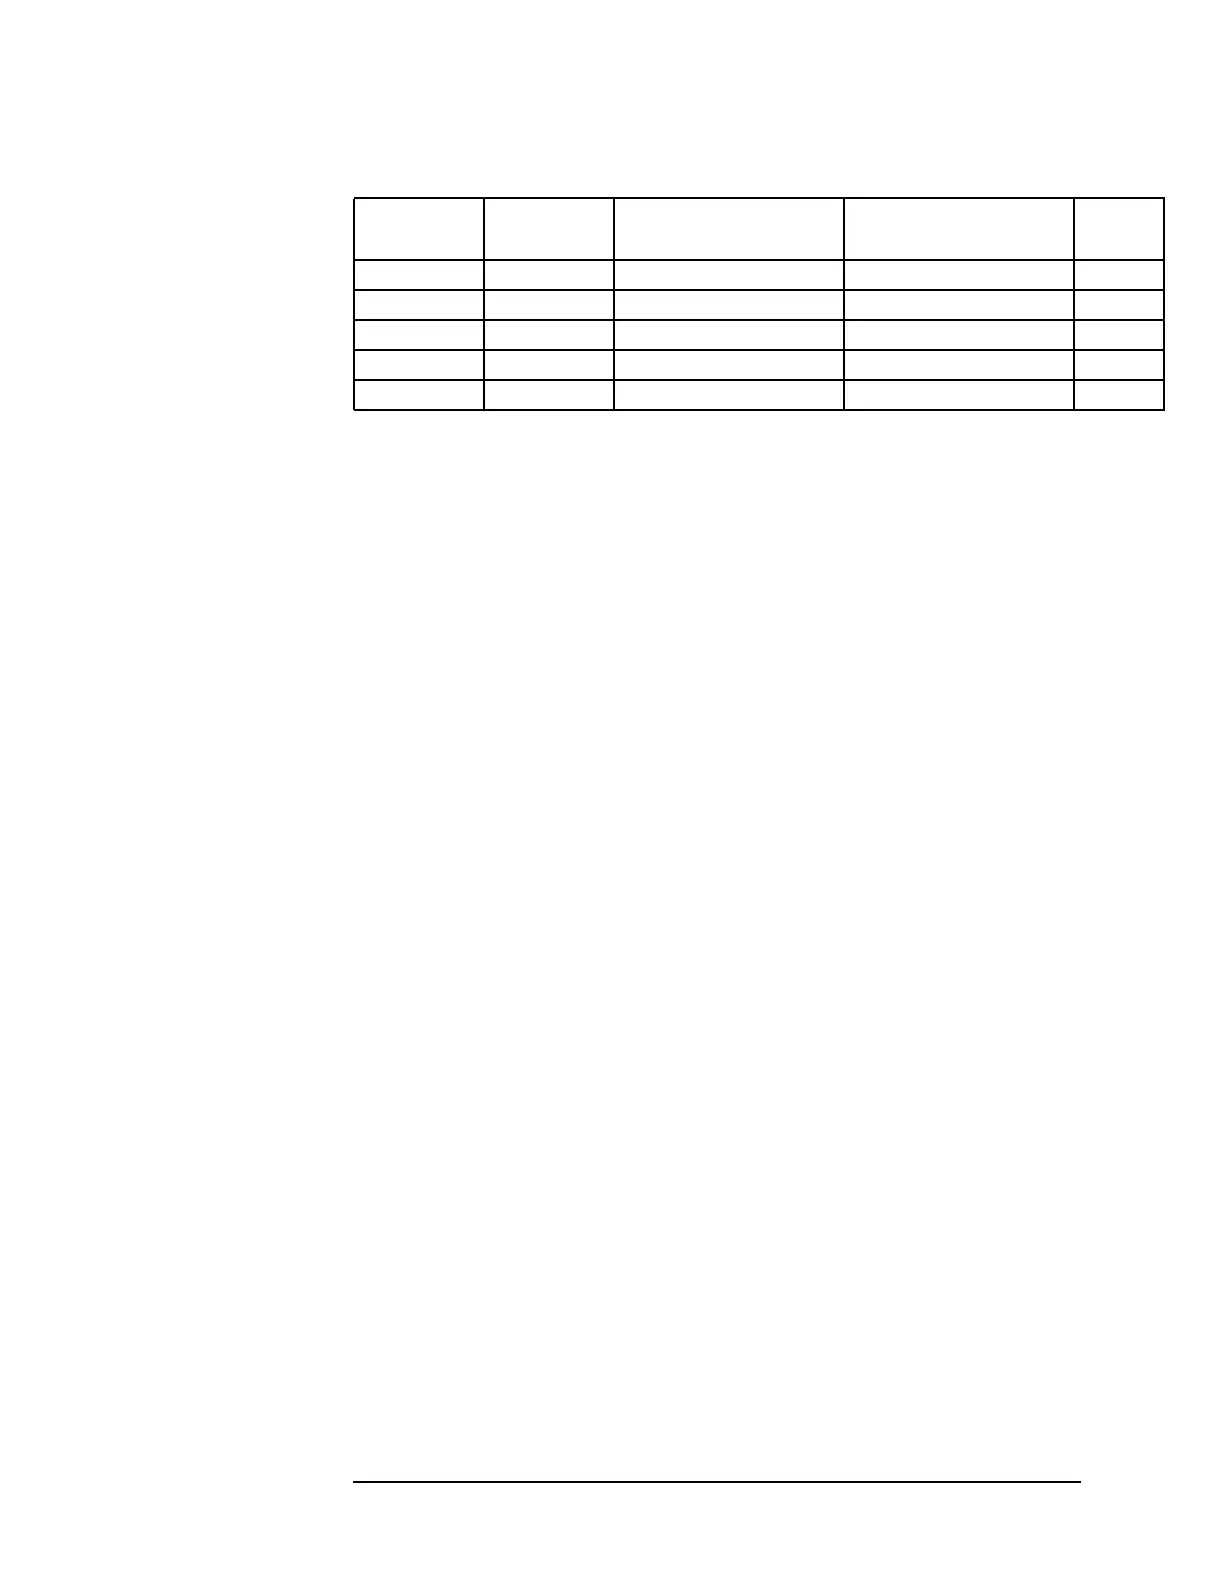
Table 8-4 IF Gain Application Guidelines (ATTEN=10 dB)
Power into
A4J3
Reference
Level
Gain of A4U201C
(Pin 8 in; Pin 3 out)
Gain of A4U201
(Pin 3 in; Pin 10 out)
Total
Gain
+6 dBm −50 dBm 0 dB 0 dB 0 dB
−4 dBm −60 dBm 0 dB 10 dB 10 dB
−14dBm −70 dBm 0 dB 20 dB 20 dB
−24 dBm −80 dBm 20 dB 10 dB 30 dB
−34 dBm −90 dBm 20 dB 20 dB 40 dB

 Loading...


