340 Using the Review Workspace
5. The Data View pane updates the graph view with the shapes you
selected.
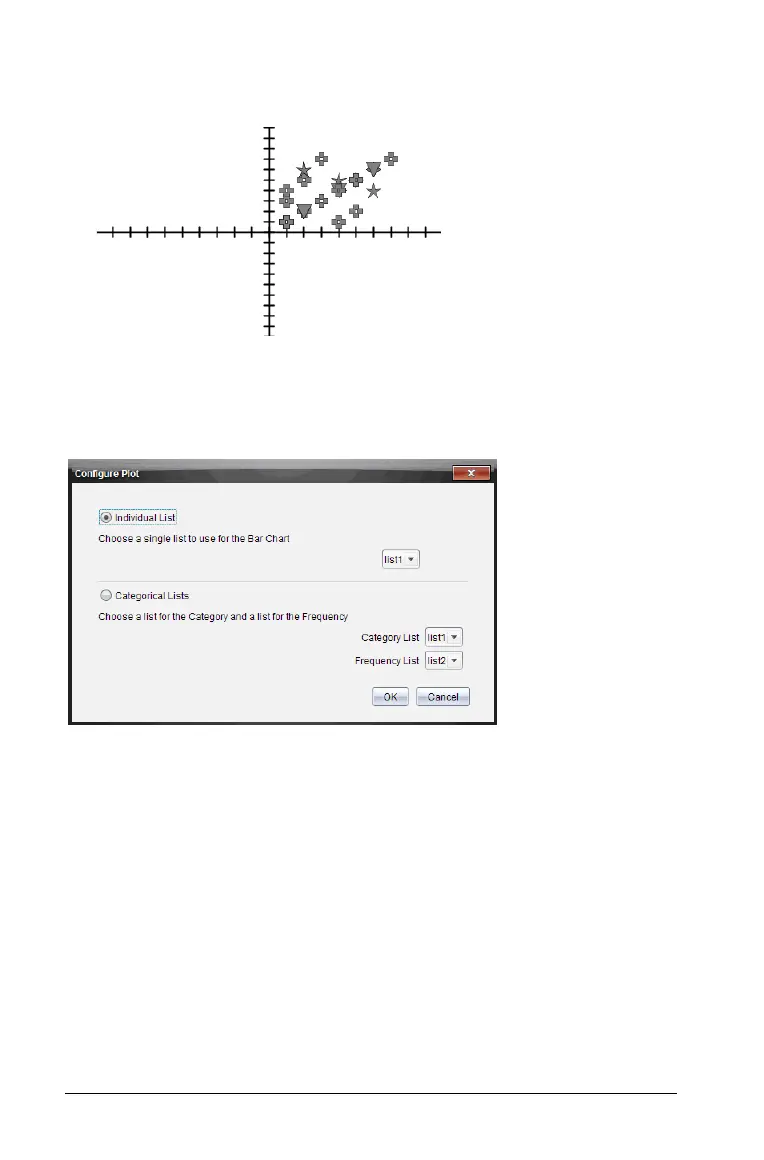
When you change plot list setting from the graph view and then change
to bar chart view, the software asks you to choose the lists to display in
the bar chart. You can choose an individual list, or a list for the Category
and a list for the Frequency.
` Mark your selections and click
OK.
If you click
Cancel, the software displays the bar chart as an individual
list, using list1 as the default.
You can configure the plot list at any time while in bar chart view.
` To configure the plot list from the bar chart view, click Organize in
the Review toolbox and select Plot List Settings.
Individualizing student responses
You can change the colors of each student’s response in a graph so you
can identify the separate responses. This is useful when you are running a
live activity; you can view the progress of individual students as they
graph functions, move points on a graph, or respond to Quick Poll
questions.

 Loading...


