Using the Review Workspace 341
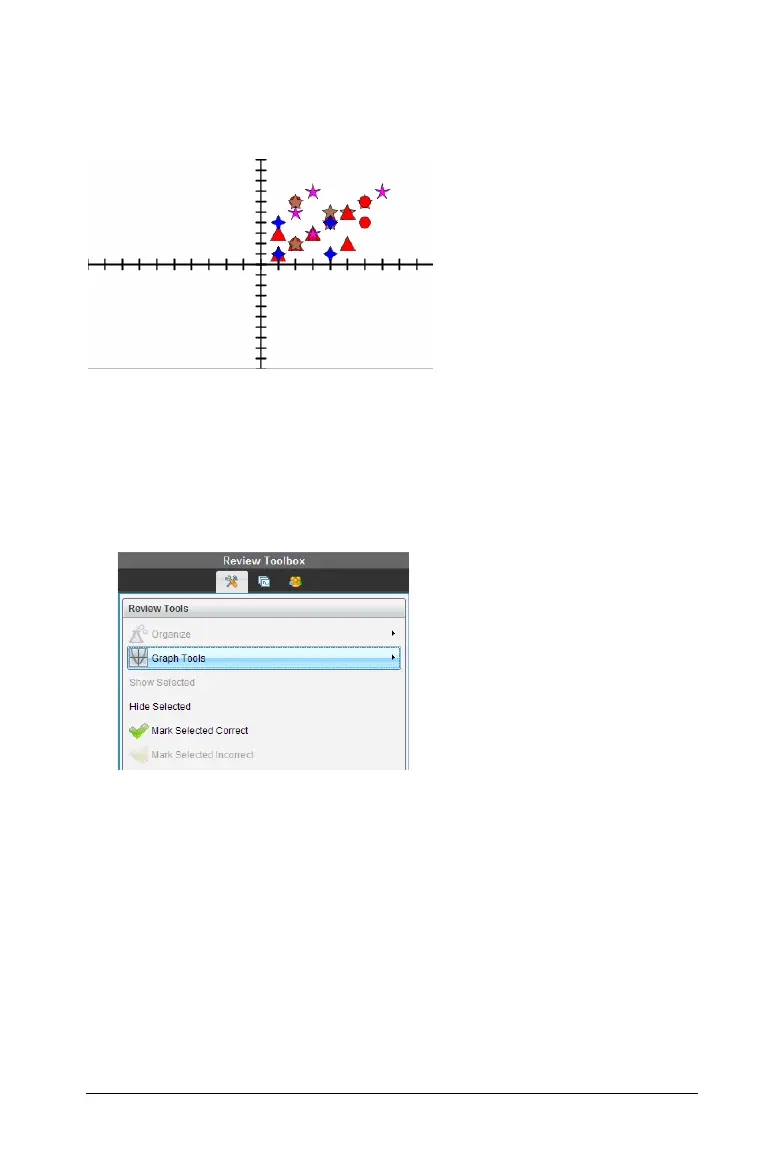
` To change the color of student responses, Click Graph Tools in the
Review toolbox and select
Individualize Student Responses.
The Data View pane displays the responses in different colors.
Organizing list data
In bar chart view, you can organize list data by Frequency, Numeric Value,
or Alphabetically.
To organize list data, follow these steps.
1. In bar chart view, click the Graph Tools bar.
2. Select to sort the bars by Frequency, Numeric Value, or Alphabetically.
The bar chart view updates in the Data View pane.
Organizing bar chart data
Organizing by separate responses shows the results for each individual
response. For example, all of the A responses, all of the Bs, all of the Cs,
and so forth. Organizing by group responses shows all multiple responses
from the students. For example, all of the A plus B responses, all of the A
plus C responses, and so forth.
Organizing by equivalency combines similar results into one bar. For
example, y=4Mx, y= Mx+4, and y= M(xM4) would all be combined into one
bar or table row.
 Loading...


