464 Graphs & Geometry
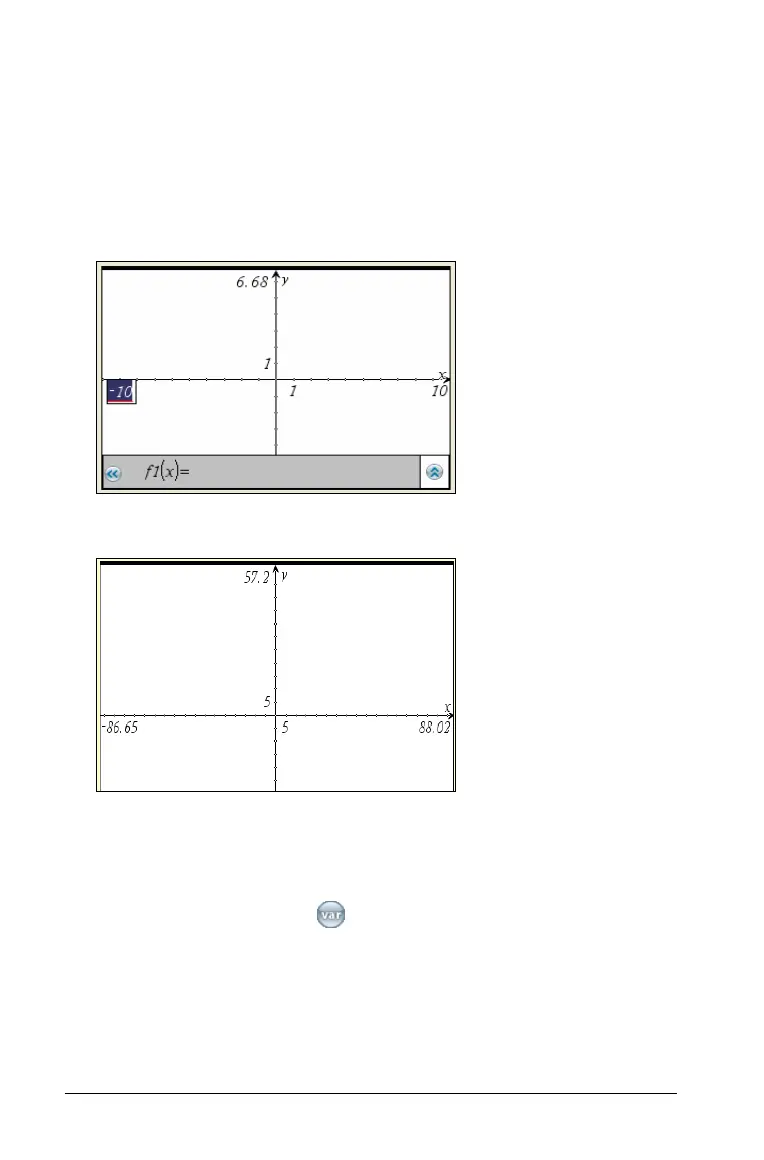
` Grab any tick mark on an axis, and drag it to rescale the view.
The aspect ratio of the axes is retained as you drag. To modify the
scale of only one axis, hold
g as you drag.
` From the
Window / Zoom menu, select Window Settings. In the
Window Settings tool, type the end values
XMin, XMax, YMin, or
YMax. To set custom spacing of the tic-marks and grid, click the down
arrow for XScale or YScale, and type a value.
Note: You can store an axis end value as a variable and then access it
outside of the Graphs & Geometry application. Select the end value in
the work area, and then click (or press
h) to store the value.
Inserting a background image
You can insert an image as a background for a Graphs & Geometry page.
The file format of the image can be .bmp, .jpg, or .png.
1. From the
Insert menu, select Image.
Default range and domain
Extended domain
 Loading...


