Graphs & Geometry 539
3. Display the slider’s context menu, select Settings, and enter the
following values.
Value: 3.8
Minimum: 3.2
Maximum: 4.4
Step Size: 0.1
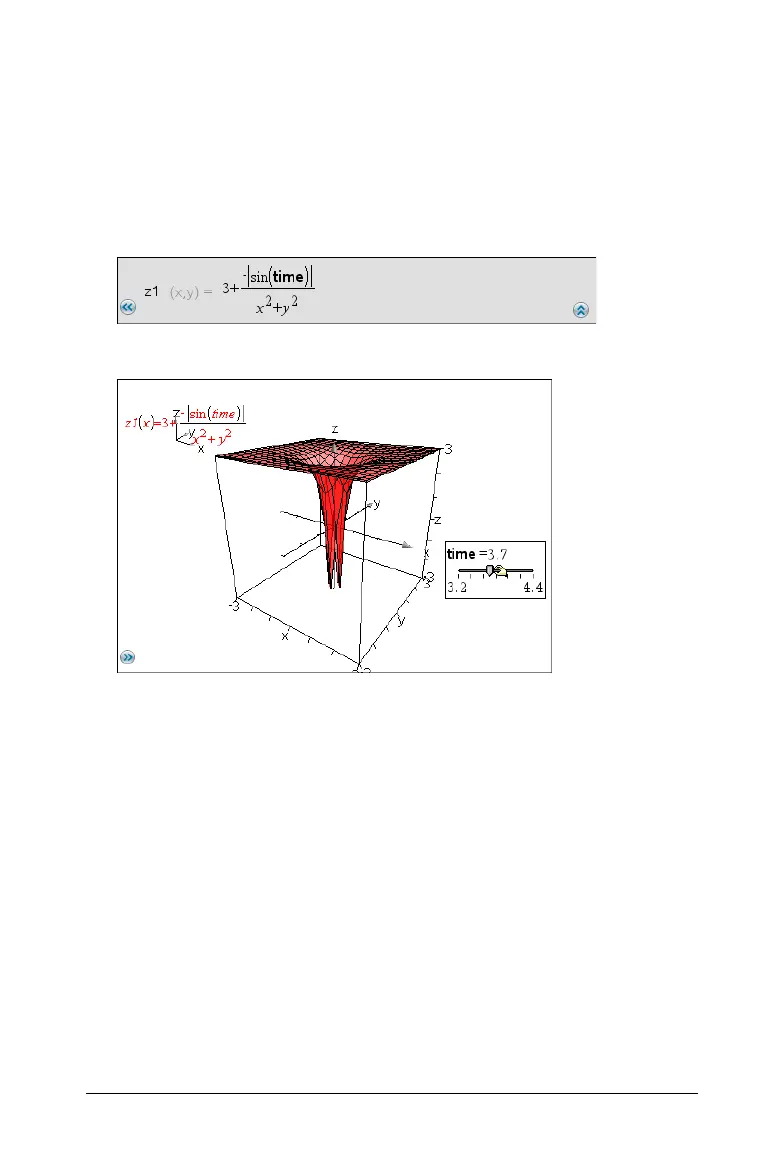
4. In the entry line, define the function shown here:
5. Drag the slider thumb to see the effect of varying time.
6. Add visual interest. For example, try:
– Rotating the graph.
– Hiding the box, axes, and legend.
– Setting the graph’s format attribute to show the surface only.
– Changing the graph’s transparency and shading attributes.
– Changing the background color and graph fill color.

 Loading...


